GeoMx® DSP: A Flexible & Scalable Platform for Spatial Biology
Quickly resolve tissue heterogeneity and the complexity of microenvironments with the GeoMx Digital Spatial Profiler (DSP), the most flexible and robust spatial multiomic platform for analysis of FFPE and fresh frozen tissue sections. GeoMx is the only spatial biology platform that non-destructively profiles expression of RNA and protein from distinct tissue compartments and cell populations with an automated and scalable workflow that integrates with standard histology staining.
What Can You Do with GeoMx DSP?
Hover over cards to learn more
Profile the Whole Transcriptome and 570+ Proteins from Intact Tissue
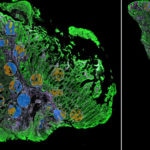
Spatially profile the whole transcriptome and 570+ protein targets separately or simultaneously from your choice of sample inputs: whole tissue sections, tissue microarrays (TMAs), or organoids. Make GeoMx DSP your spatial biology platform of choice for biomarker discovery and hypothesis testing.
You Decide Where to Draw the Line
with Biology-Driven Profiling
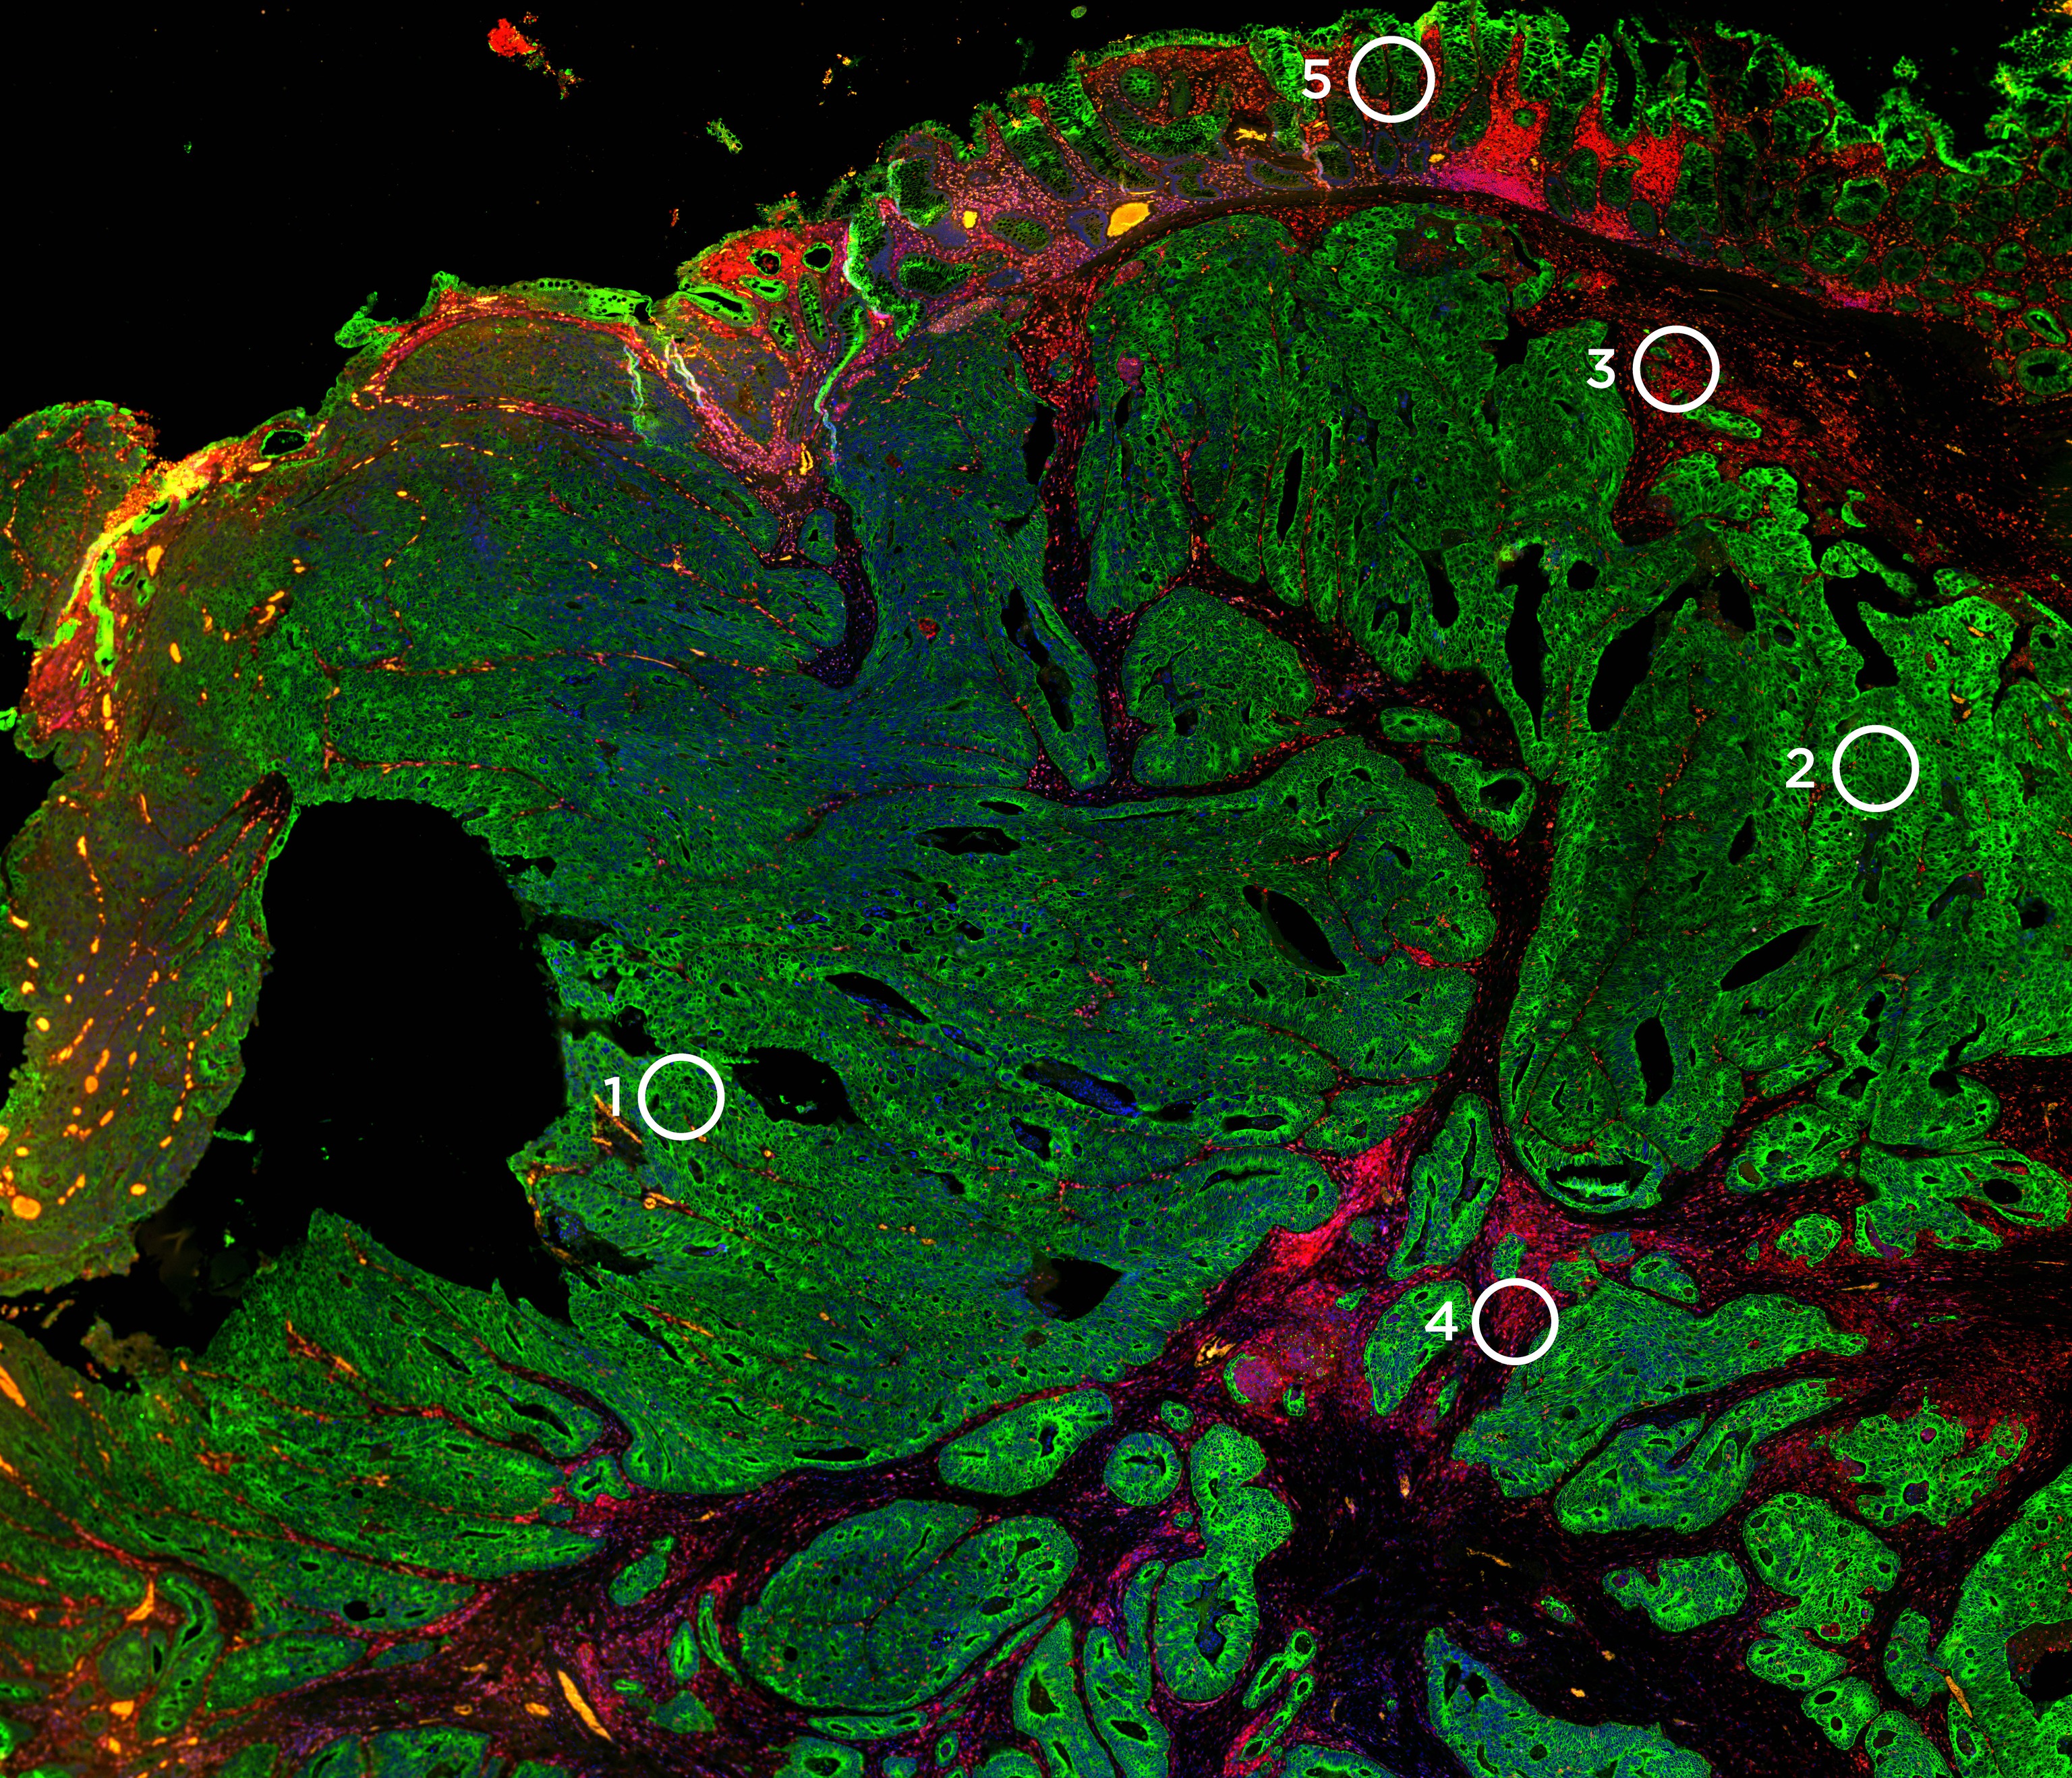
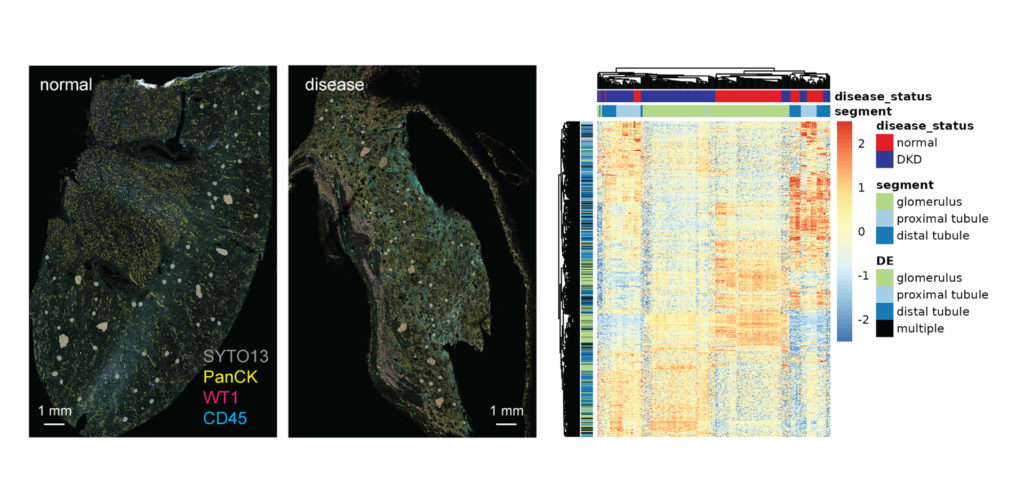
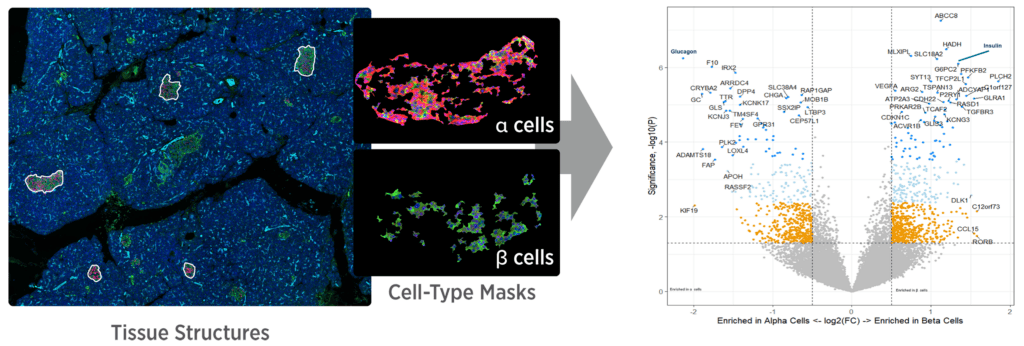
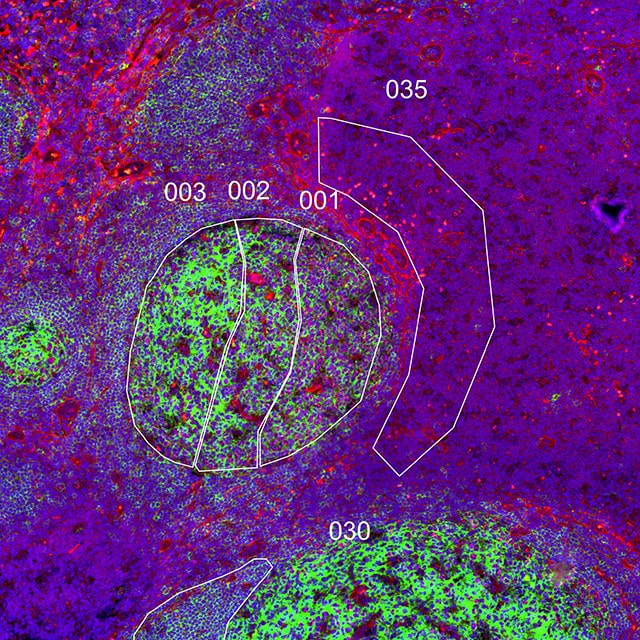
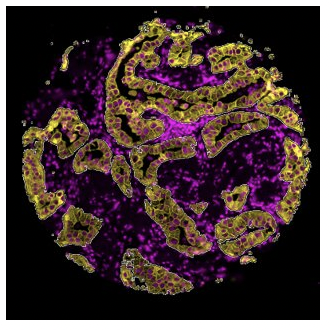
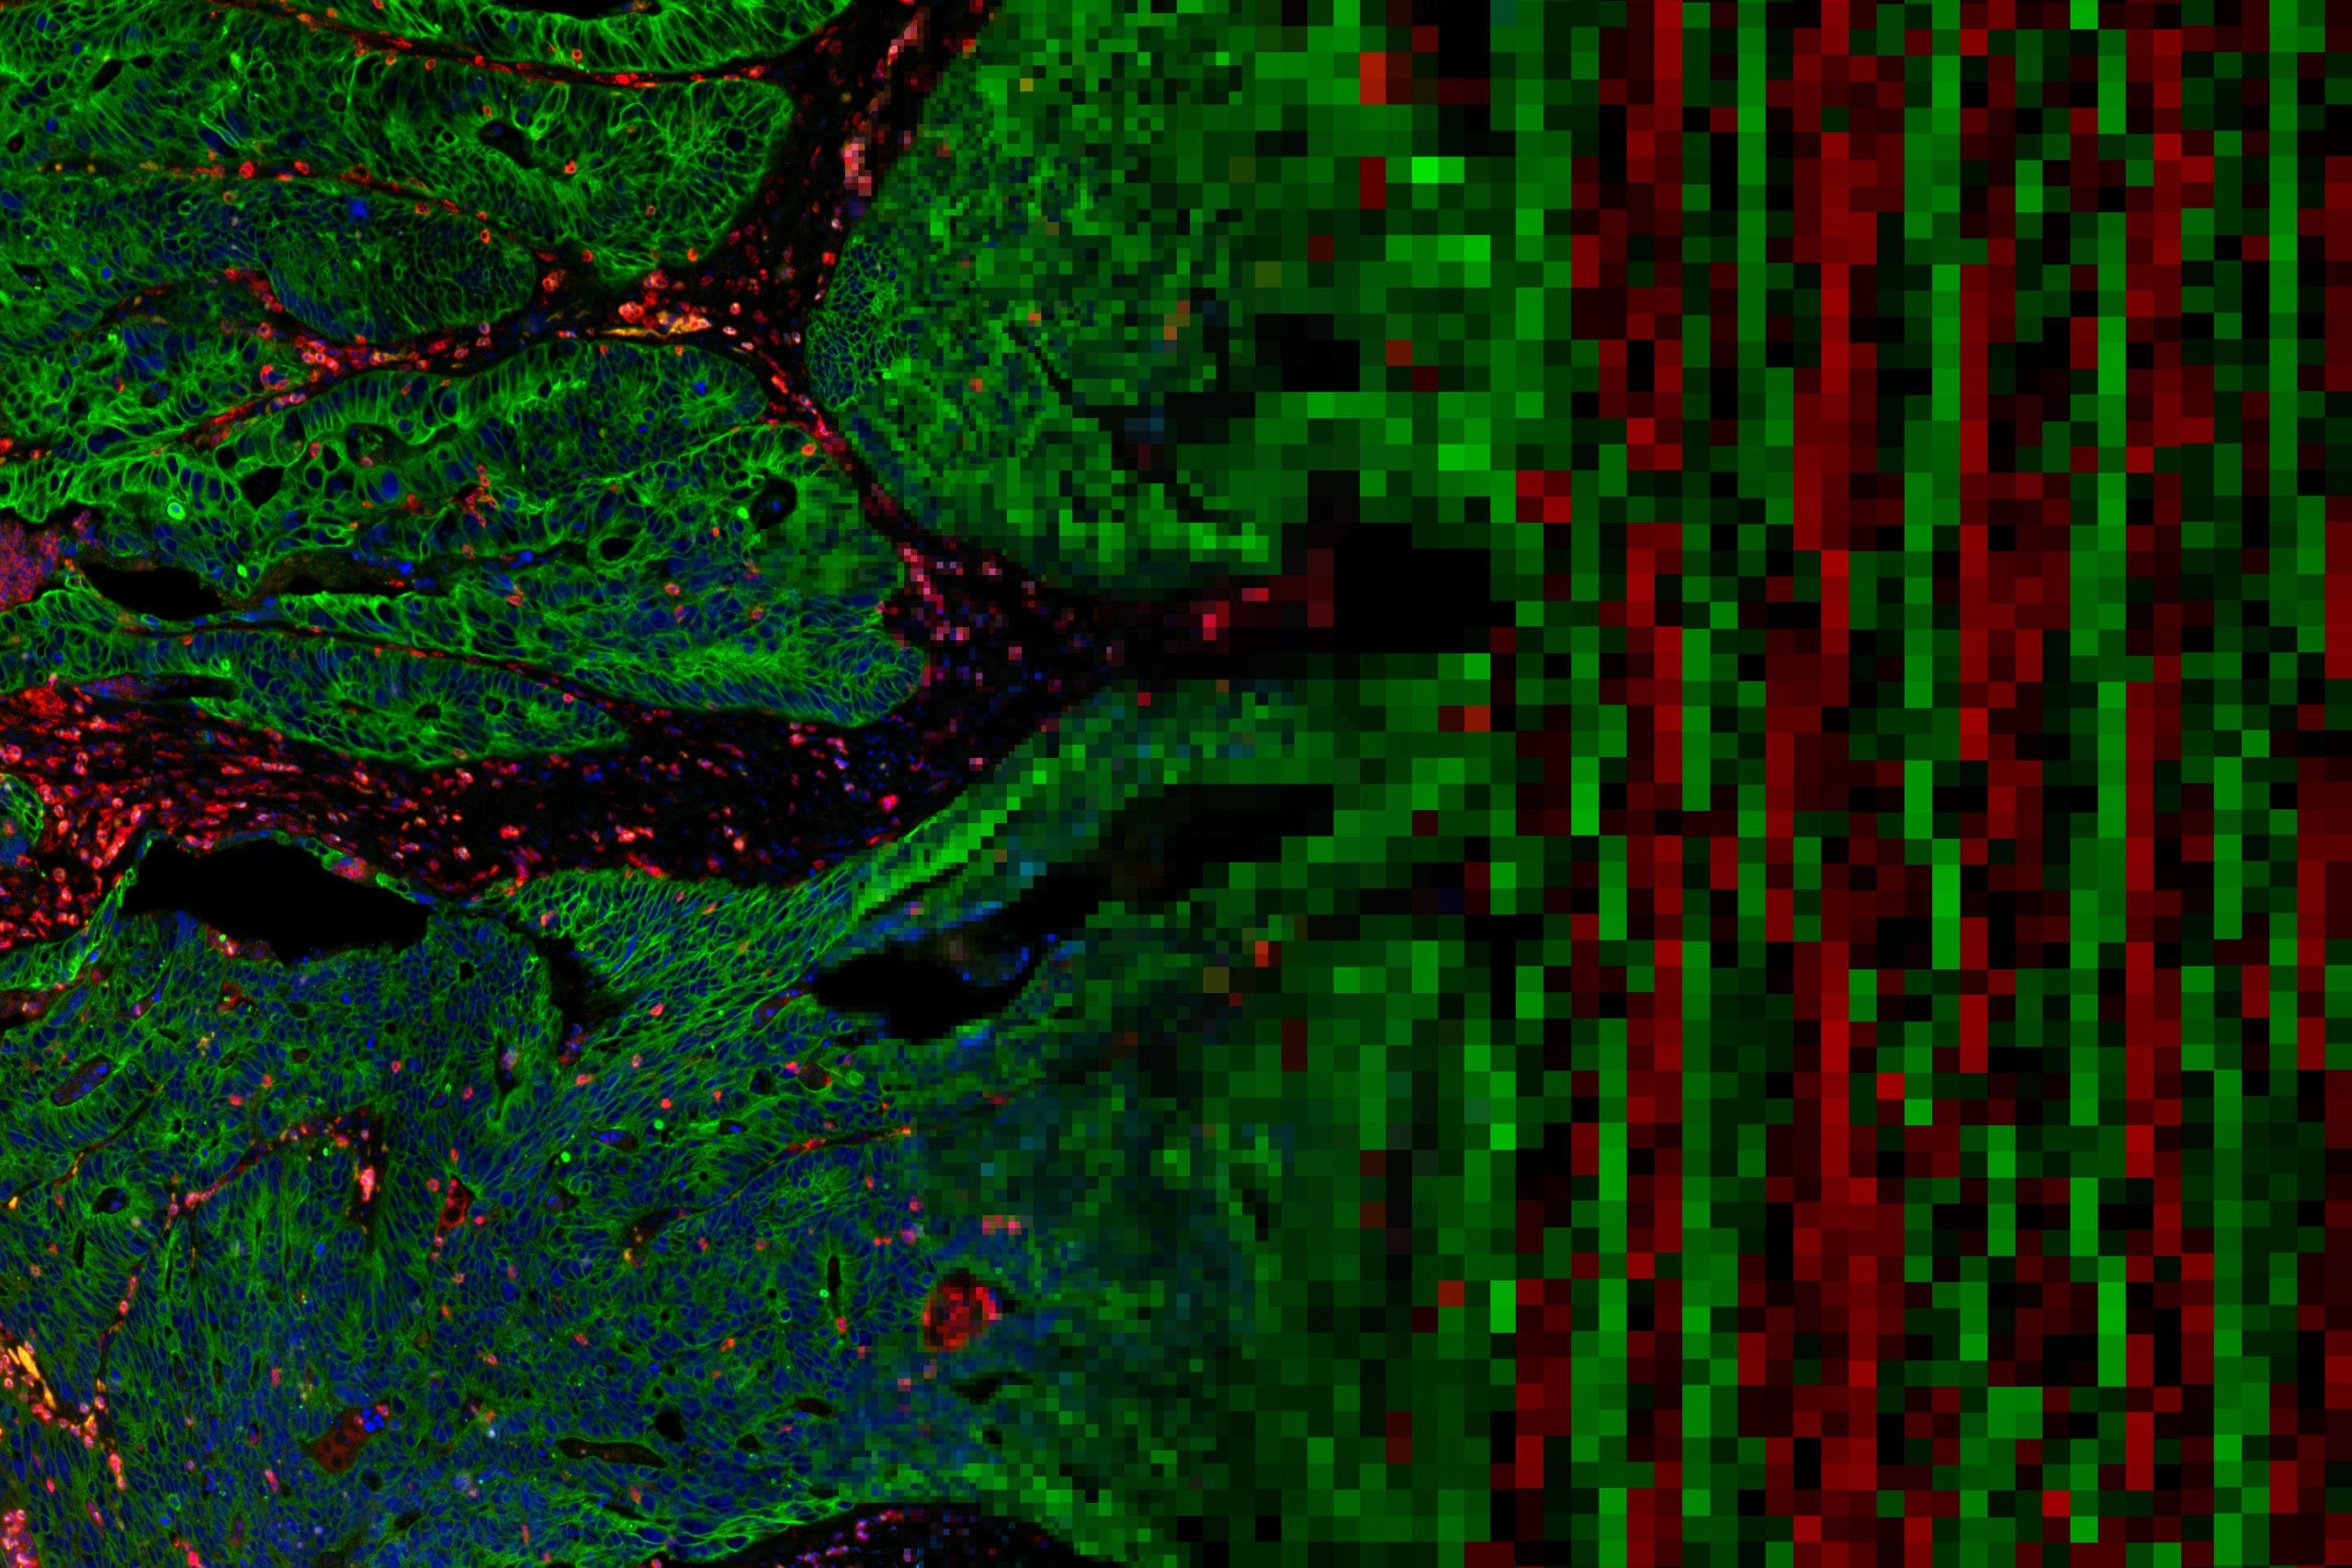
Decide where to draw the line and let the tissue be your guide with biology-driven profiling that empowers you to choose the tissue microenvironments and cell types that matter most to you. Choose which regions to profile and segment each region into different compartments using fluorescent staining patterns as a mask to profile expression in certain tissue types or cell populations.

The GeoMx DSP Advantage
Capture tissue heterogeneity through flexible profiling
Geometric Profiling
What is the heterogeneity of expression in different regions of my
tissue?
Segmentation
What is the expression profile of distinct biological compartments
(e.g., Tumor-TME)?
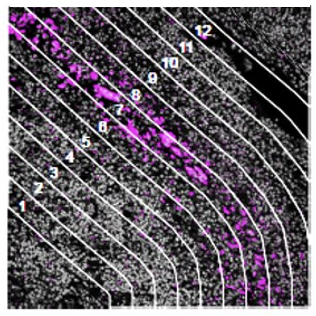
Contour
How does the immune environment change on either side of an infiltrate
boundary?
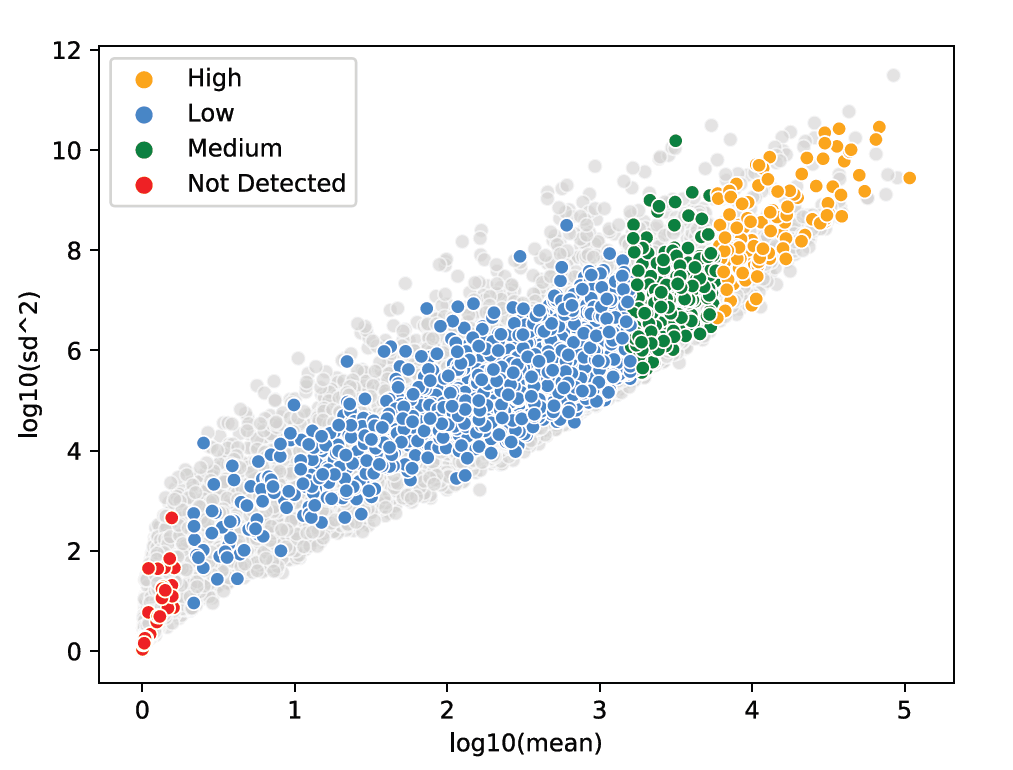
Take advantage of probe-based chemistry to access five logs of dynamic range for detecting low, medium, and high expressors and handle tissue quality variability.
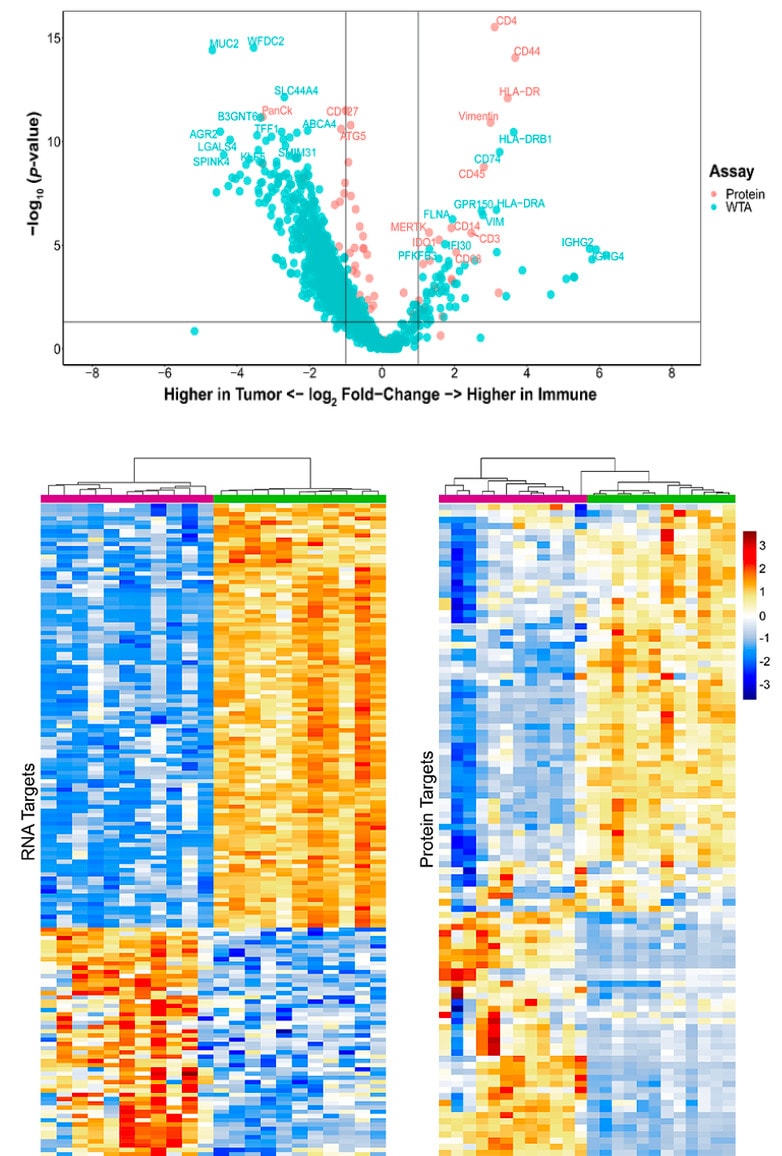
Analyze the differential expression of 570+ proteins and the whole transcriptome spatially on the same tissue section or on serial sections to get a complete proteogenomic picture of cell state, signal transduction, and biological pathways to find new biomarkers, drug targets, and drug mechanism of action.
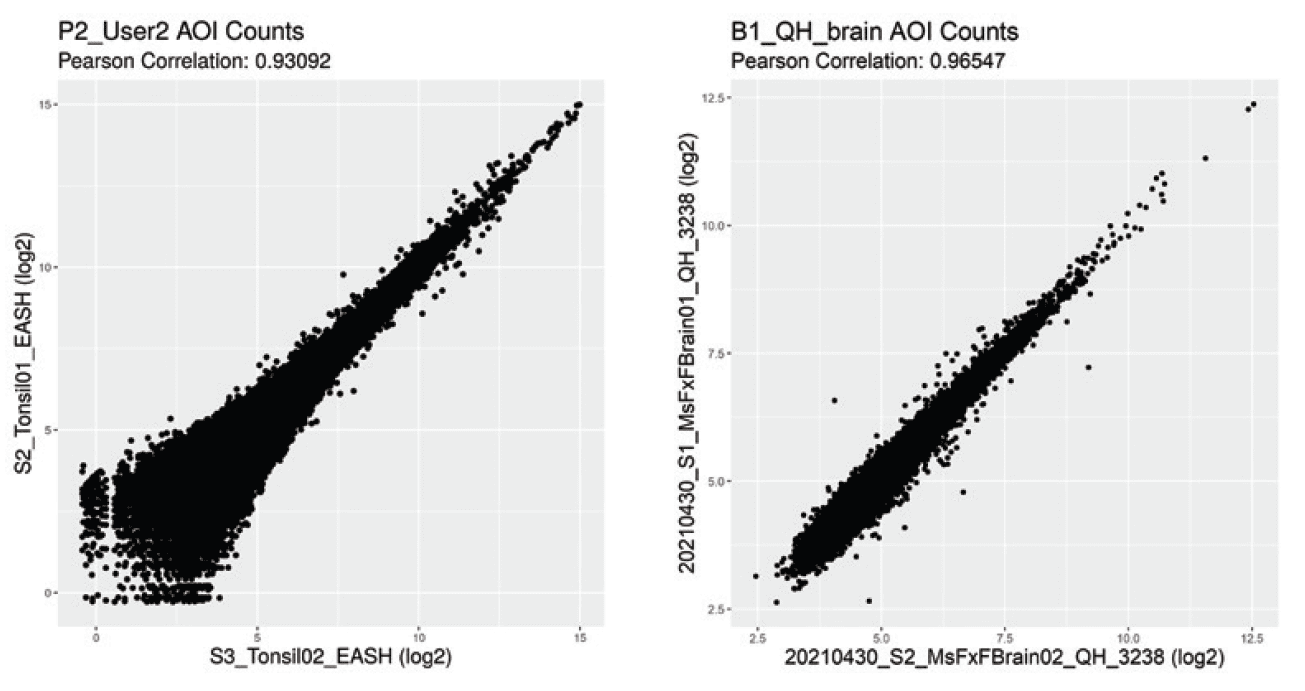
Get consistent results and reliable answers on a reproducible platform ideal for large cohort studies across multiple sites.
Scale up to large cohort studies with a workflow that can be automated. Use the large scan area to maximize the number of samples per slide by placing multiple tissue samples per slide or by using a tissue microarray. Automate staining prep on the BOND RX or RXM Fully Automated Research Stainer from Leica Biosystems; stain slides in batches and store them in the fridge to run together later with no effect on performance. Use AI-driven digital pathology software from Visiopharm to support ROI selection. Take advantage of a throughput of up to 40 slides/week with unattended overnight runs and leverage integration with Illumina’s sequencing platforms and data analyis pipelines.
Spike-in probes for RNA or protein targets of your choice whether they are exogenous, endogenous, microbial, viral, or any non-human species. Take advantage of our GeoMx Barcoding Service. Spike-in up to 400 RNA targets into any NGS readout assay or run two panels of up to 200 targets each as a standalone RNA assay. Spike in up to 40 custom antibodies to any NGS readout protein assay or add in up to 10 antibodies to any nCounter readout protein assay.


How It Works
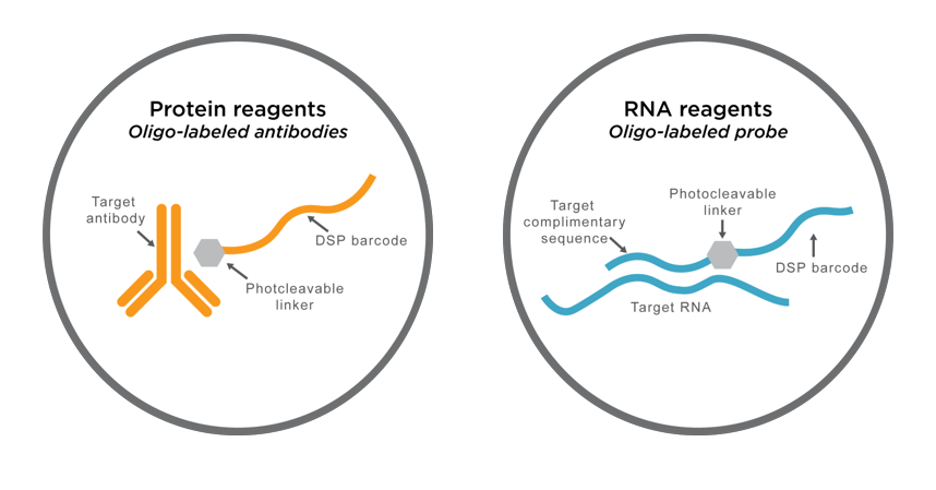
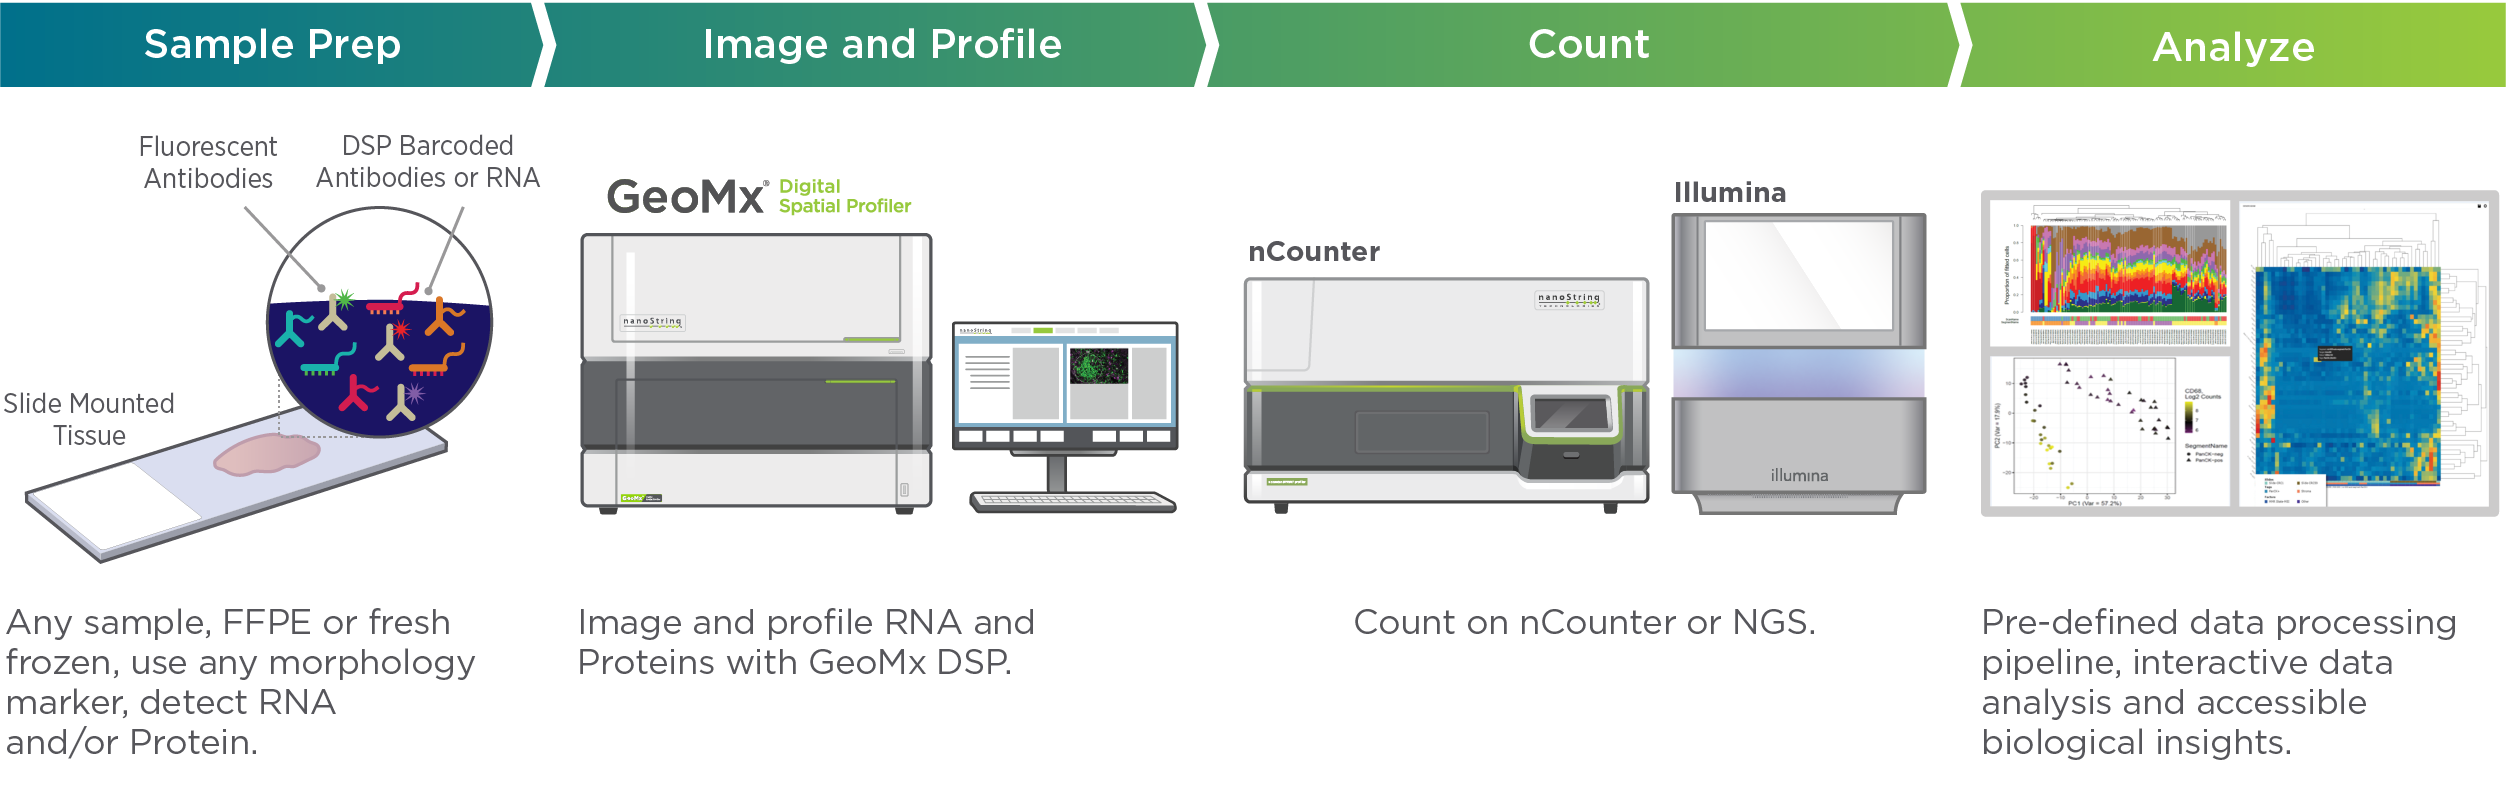
DSP assay probes consist of either antibodies or in situ hybridization (ISH) probes tagged with unique oligonucleotide barcodes that are released upon exposure to UV light.
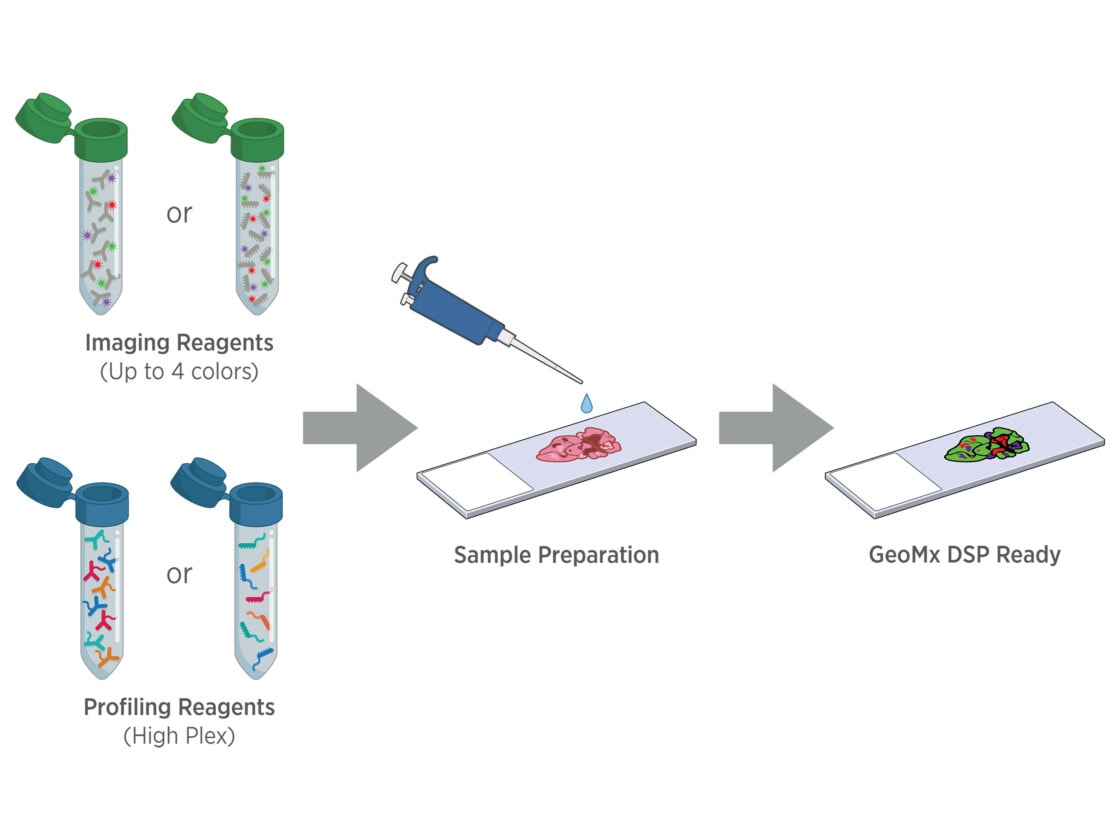
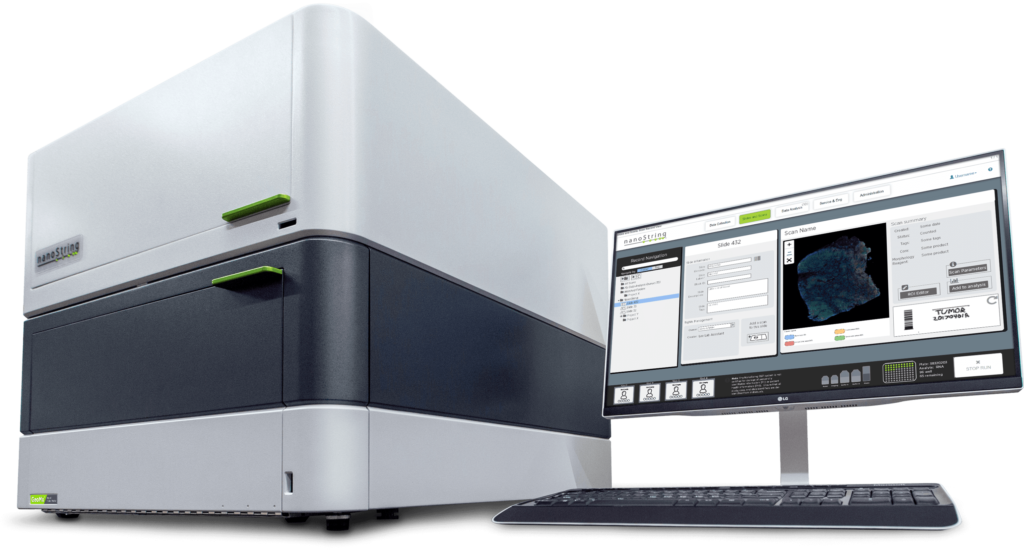
Tissue samples are stained with fluorescently tagged imaging probes and assay probes using a standard histology workflow. No special mounting is required, and sample staining can be automated using the BOND RX or RXm fully automated research stainer from Leica Biosystems.
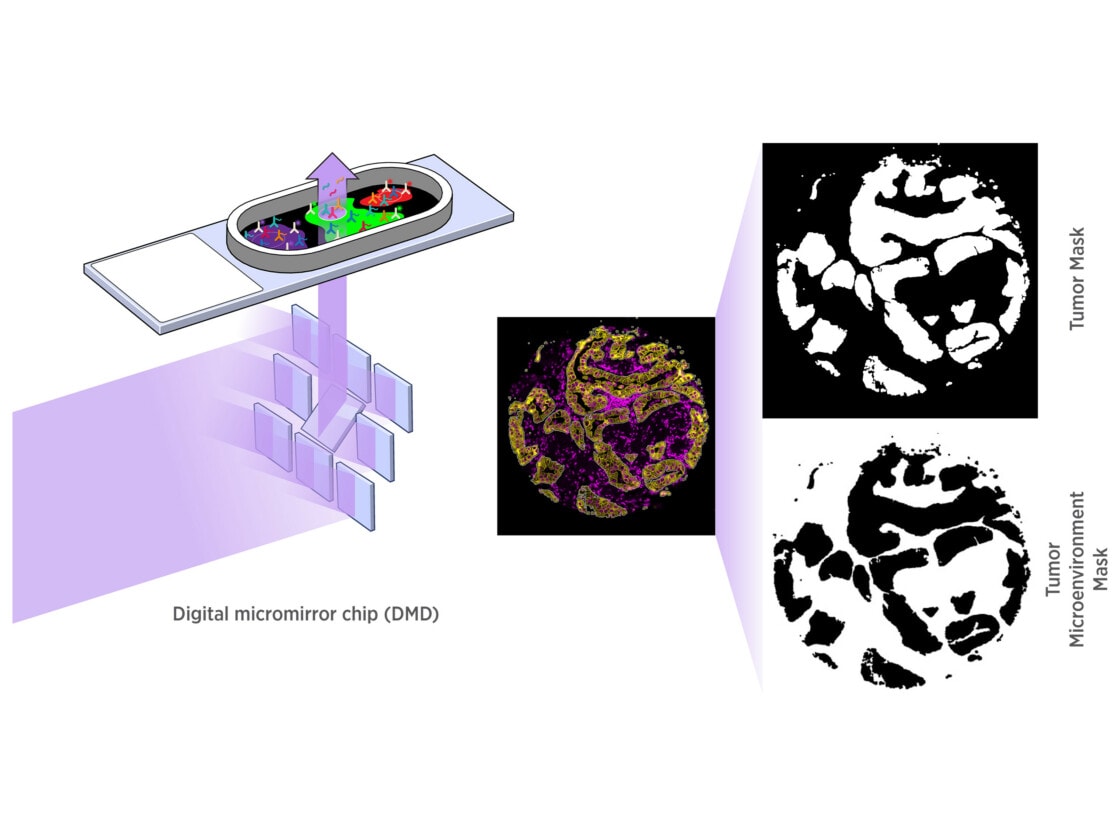
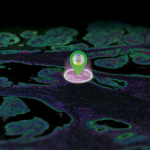
GeoMx DSP empowers you to select distinct tissue compartments or cell types with a resolution down to 10 microns. Using an array of micromirrors, the tissue is exposed to UV light only in those areas selected for masking, including non-contiguous areas. Barcodes are released and quantified downstream.
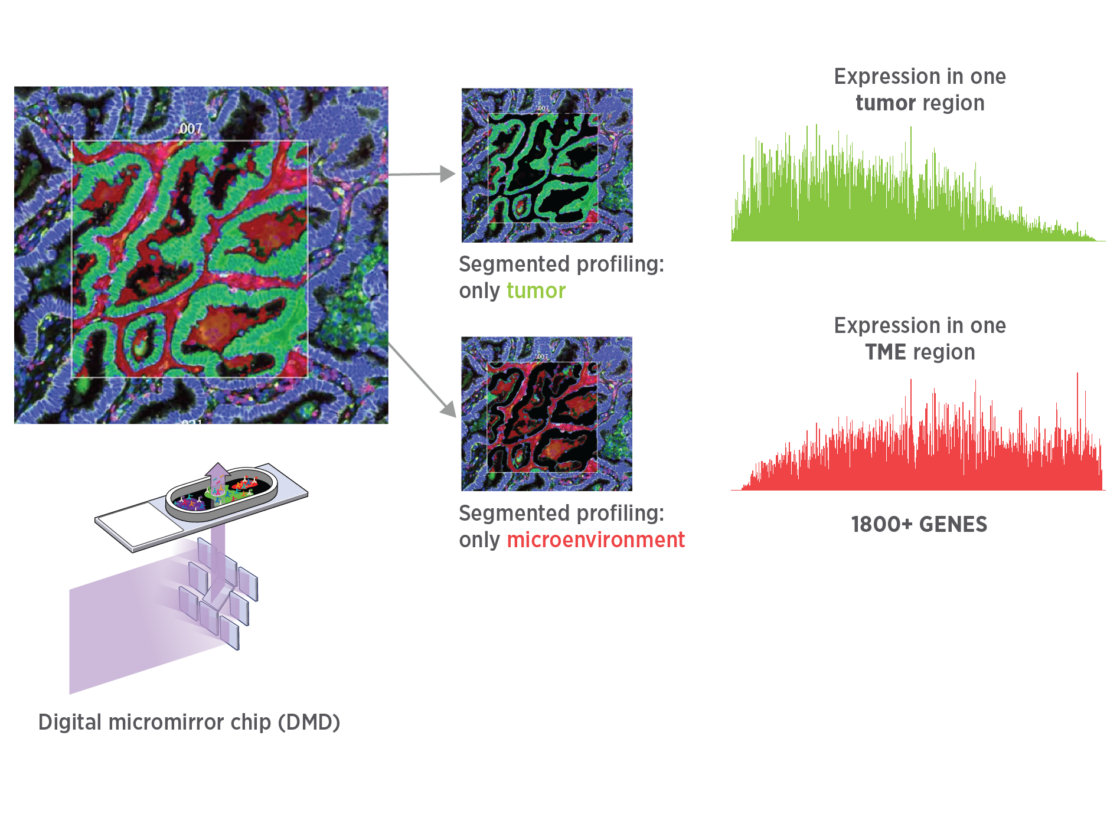
Get unbiased spatial expression from each tissue mask with sensitivity to detect low, medium, and high expressors.

Learn more in our GeoMx 101 course via NanoString University »

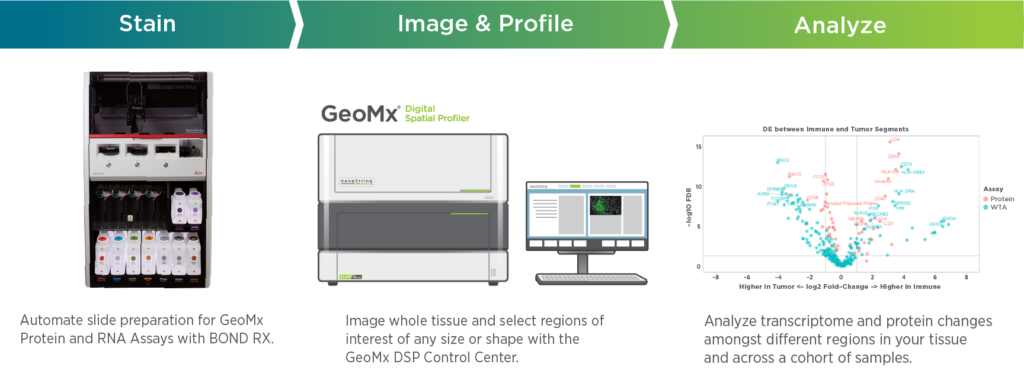
The GeoMx DSP Workflow
Stain whole slides with assay probes and up to four fluorescent markers and then image them on the instrument. With fluorescent staining as your guide, decide which regions of the tissue you want to profile, and using masking, optionally profile two or more tissue compartments or cell types in each region. Quantify RNA and protein expression levels with direct, digital counting of barcodes using the nCounter® Analysis System or sequencing on an Illumina platform. Analyze your data with the provided DSP Data Analysis Suite (DSPDA), open-source tools, or our Spatial Data Analysis Service (SDAS).

GeoMx Publications
Assessing Longitudinal Treatment Efficacies and Alterations in Molecular Markers Associated with Glutamatergic Signaling and Immune Checkpoint Inhibitors in a Spontaneous Melanoma Mouse Model
Previous work done by our laboratory described the use of an immunocompetent spontaneous melanoma-prone mouse model, TGS (TG-3/SKH-1), to evaluate treatment outcomes using inhibitors of glutamatergic signaling and immune checkpoint for 18 weeks. We showed a significant therapeutic efficacy with a notable sex-biased response in male mice.
Spatial transcriptomics reveals molecular dysfunction associated with cortical Lewy pathology
A key hallmark of Parkinson’s disease (PD) is Lewy pathology. Composed of α-synuclein, Lewy pathology is found both in dopaminergic neurons that modulate motor function, and cortical regions that control cognitive function.
Digital spatial profiling identifies molecular changes involved in development of colitis-associated colorectal cancer
Objective: Chronic colonic inflammation seen in inflammatory bowel disease (IBD) is a risk factor for colorectal cancer (CRC). Colitis-associated cancers (CAC) are molecularly different from sporadic CRC.
Related Resources


Request a Quote
Contact our helpful experts and we’ll be in touch soon.