Lymph Node 6k README
-
1 Introduction
FFPE from a reactive follicular lymphoid hyperplasia 1 sample 2 was run on the CosMx SMI using the commercially available CosMx Human 6K Discovery Panel. Table 1.1 provides a summary of the raw data.
This document describes the various formats that are publicly available. This includes Seurat, napari-cosmx, and “flat file” formats. Within each of these formats, we included cell typing data for cells that passed a QC filter.
Table 1.1: High-level summary of Lymph Node. Lymph Node 6K Number of FOVs 400 Total Tissue Area (um²) 104,334 Mean Single Cell Size (um²) 50.759 Number of Cells in Final Analysis 1,852,946 Total Transcripts Assigned to Cells 1,378,108,235 Mean Transcripts per Cell 743.739 Median Transcripts per Cell 680 Maximum Transcripts per Cell 8,736 Mean Unique Genes per Cell 460.901 Mean Transcripts per (um²) 14.652 Mean Negative Counts per Cell 0.384 Mean Negative per Plex per Cell 0.019 Mean False Codes per Plex per Cell 0.005 Signal to Noise 6.271 -
2 Seurat format
A preloaded Seurat object is supplied. This object is compatible with the latest Seurat version (V5).
Click to see code used to generate the image below
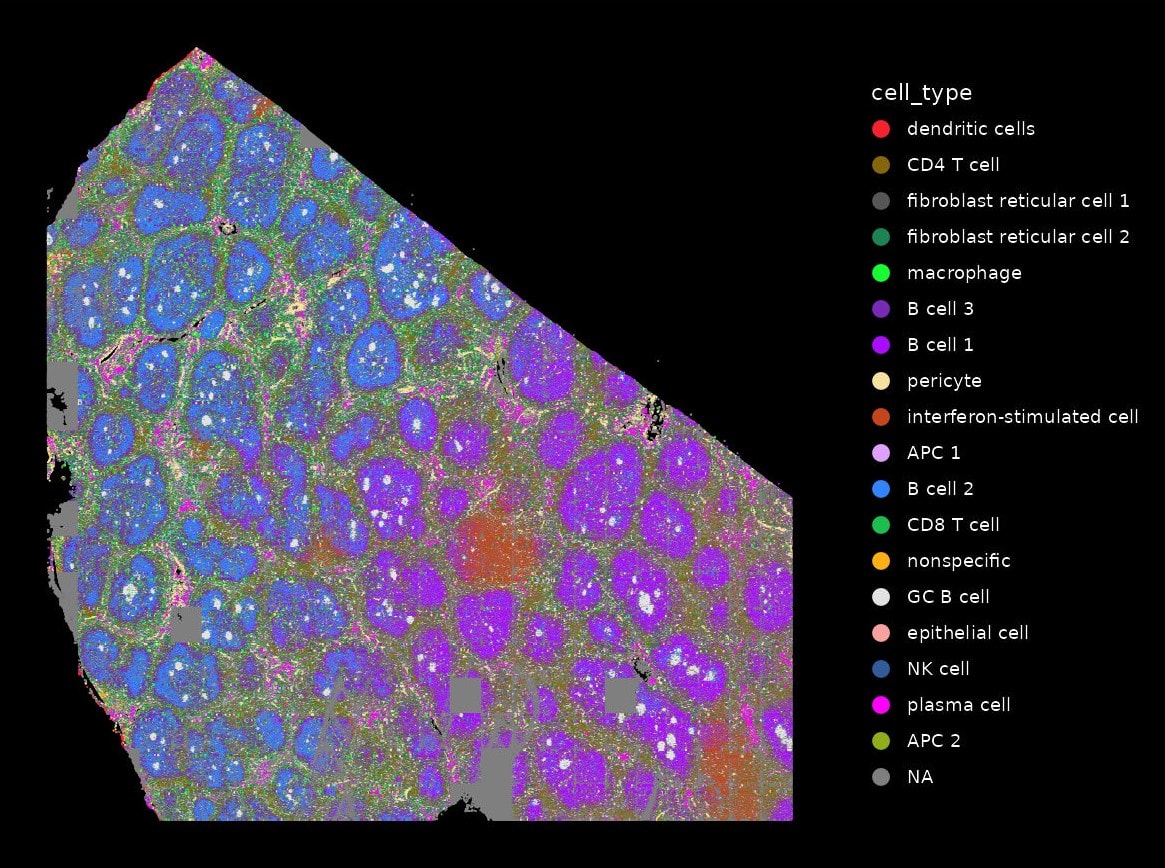
Figure 2.1: Cell types across space using Seruat’s ImageDimPlot function.
-
3 Napari files
We have prepared the data into a format that can be used with the napari-cosmx plugin described on Scratch Space. Users can install this experimental plugin to view and analyze the image data.
With 400 FOVs and more than 6,000 features, the total size of the napari folder is 100 GBs. Of the total, the targets.hdf5 (md5 = c74617a8bf517f2392b7811b85aa1585) file comprises 41 GBs and stores the target coordinates. The _metadata.csv file contains the cell types for each cell and is automatically read into napari upon launch. For more information on how to load with the plugin, see the Scrach Space post . The majority of files are zarr files in the images subdirectory. There is a separate subdirectory for each IF image and a subdirectory for the cell boundaries (“labels”).
Click to see code used to generate the napari images below
- IF
- Cell Types
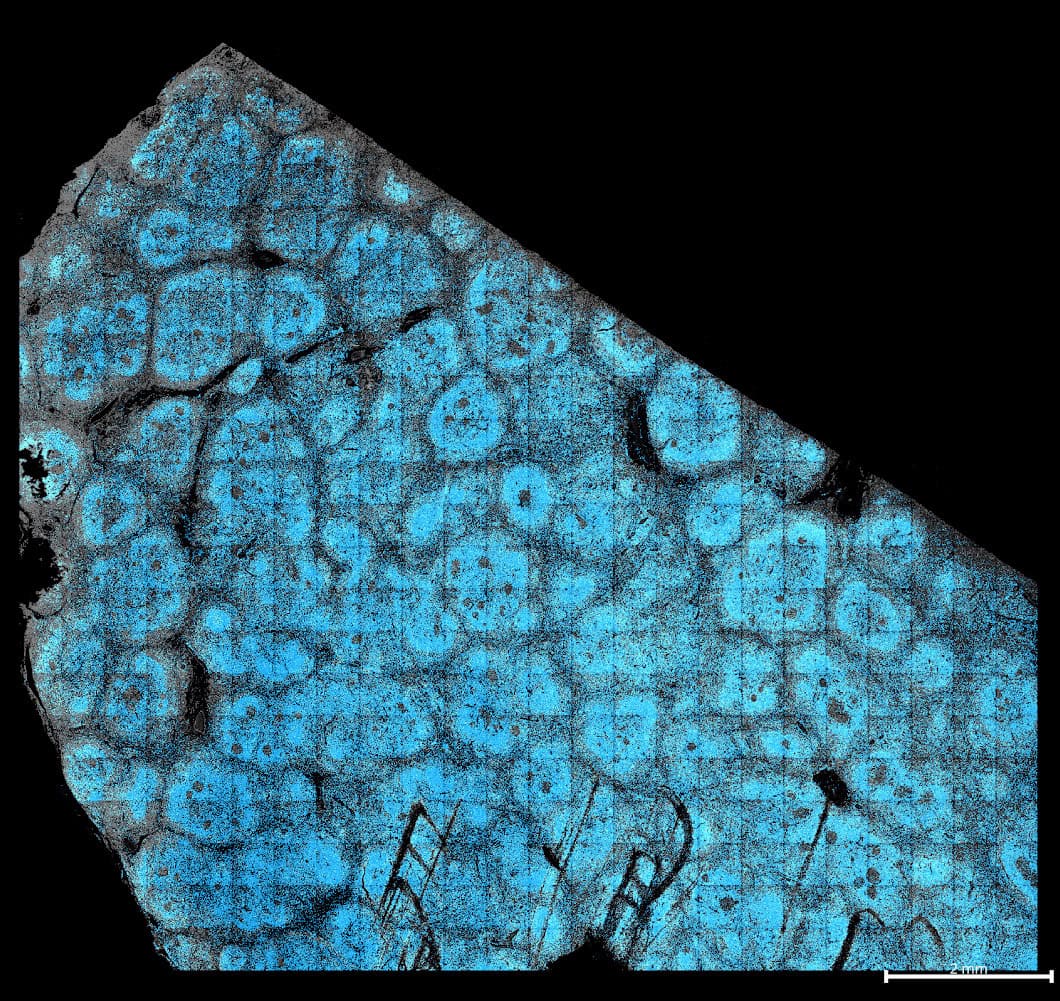
Figure 3.1: Napari image with control panels. Grey = Membrane; Blue = DNA.
-
4 Flat File Descriptions
A preloaded Seurat object is supplied. This object is compatible with the latest Seurat version (V5).
Click to see code used to generate the image below
Table 1.1: High-level summary of Lymph Node. Name File Name Size MD5 Transcript Coordinates S0_tx_file.csv.gz 30.8 GBs 7d39ecb7ac81260e4dc128f992358894 Cell Expression S0_exprMat_file.csv.gz 1.19 GBs d10ddb05447fc0ce00d0a53c14ee7dd8 Cell Metadata S0_metadata_file.csv.gz 134.61 MBs d10ddb05447fc0ce00d0a53c14ee7dd8 FOV positions S0_fov_positions_file.csv.gz 3.35 KBs ed5e566eacbacef21f712835feb2c8a9 Polygons S0-polygons.csv.gz 517 MBs 6d04e6348034f441c85e615de9ebebcf Note: Flat files were generated with AtoMx SIP v 1.3.2. For more information between this version and legacy versions, please see our blog post.
-
4.1 Transcript Coordinates
Table 4.2: Ten random rows of the S0_tx_file.csv.gz transcript coordinates file. fov cell cell_ID x_local_px y_local_px x_global_px y_global_px ztarget CellComp 2 873 1_2_873 3046 2815 21143.256 86763.5647 1IDHI Cytoplasm 47 132c 1_47_132 3512 114 29115.536 68140.8882 0_SUPT4H1 Cytoplasm 79 1027 1_79_1027 3326 843 41727.455 58878.7754 3NDUFA3 Nuclear 97 4302 1_97_4302 2979 3401 45645.324 52048.5123 5_MDM4 Nuclear 171 536 1_171_536 607 441 4874.121 37951.2151 0_NDUFS7 Nuclear 253 5228 1_253_5228 3221 4049 50154.006 21537.1052 -1_RSAD2 Cytoplasm 297 3070 1_297_3070 2783 2728 36917.039 14329.3798 4_PSMB10 Cytoplasm 359 4846 1_359_4846 3870 3401 16676.472 857.2823 8_CD53 Nuclear 384 1066 1_384_1066 2606 834 32474.190 -836.2533 4_PPPR12A Cytoplasm 384 5074 1_384_5074 2501 4124 32368.755 -4133.2742 5_MTFR1 Cytoplasm Table 4.3: Description of the baseline transcripts file format for AtoMx SIP v1.3.2. Column Name Type Description fov Int The field of view (FOV) number. cell_ID Int Unique identifier for a single cell within a given FOV. To make a unique identifier for a cell within the whole sample use both the fov and cell_ID columns. cell string A study-wide unique cell identifier. Combination of cell, slide ID, fov, and cell_ID. Note that this is equivalent to cell_ID in napari-cosmx. x_local_px float The x position (in pixels) relative to the given FOV. y_local_px float The y position (in pixels) relative to the given FOV. x_global_px float The x position (in pixels) relative to the tissue. y_global_px float The y position (in pixels) relative to the tissue. z Int The z plane. target string The name of the target. CellComp string Subcellular location of target. -
4.2 Cell Expression
Table 4.4: Head and tail of expression matrix in S0_exprMat_file.csv.gz. Elipses show truncated rows and columns. fov cell_ID A1BG A2M AAAS Truncated1 ZYG11B ZYX ZZZ3 Negative1 Truncated2 Negative9 SystemControl1 Truncated3 SystemControl99 1 1 8 0 0 ... 0 0 0 0 ... 0 0 ... 0 1 2 9 0 1 ... 0 0 0 0 ... 0 0 ... 0 1 3 8 0 0 ... 0 0 0 0 ... 0 0 ... 0 1 4 13 0 0 ... 0 0 0 0 ... 0 0 ... 0 1 5 3 0 0 ... 0 0 0 0 ... 0 0 ... 0 ... ... ... ... ... ... ... ... ... ... ... ... ... ... ... 400 5309 7 0 0 ... 0 0 0 0 ... 0 0 ... 0 400 5310 1 0 0 ... 0 0 0 0 ... 0 0 ... 0 400 5311 5 0 0 ... 0 0 0 0 ... 0 0 ... 0 400 5312 3 0 0 ... 0 0 0 0 ... 0 0 ... 0 400 5313 10 0 0 ... 0 1 0 0 ... 0 0 ... 0 Table 4.5: Description of the baseline expression matrix file format for AtoMx SIP v1.3.2. Column Name Type Description fov Int The field of view (FOV) number
Unique identifier for a single cell within a given FOV. To make a unique identifier for a cell within the whole sample use both the fov and cell_ID columns. All transcripts not assigned to a cell are show with a cell_ID value of 0.cell_ID Int (Gene expression target) Int The number of transcripts observed for a given gene target for a given cell. (Negative Probe, e.g., Negative1) Int Negative probes, which do not match any sequence within the transcriptome or genome. These can be used to assess background levels. (System Control) Int System Control codes are codes which do not have any physical probe associated with them. -
4.3 Cell Metadata
Table 4.6: Random sample of 10 cells of the S0_metadata_file.csv.gz metadata file. fov Area AspectRatio Width Height Mean.B Max.B Mean.G Max.G Mean.Y Max.Y Mean.R Max.R Mean.DAPI Max.DAPI SplitRatioToLocal NucArea NucAspectRatio Circularity Eccentricity Perimeter Solidity cell_id X version dualfiles Run_name Run_Tissue_name ISH.concentration Dash tissue Panel assay_type slide_ID cell_ID unassignedTranscripts median_RNA RNA_quantile_0.75 RNA_quantile_0.8 RNA_quantile_0.85 RNA_quantile_0.9 RNA_quantile_0.95 RNA_quantile_0.99 nCount_RNA nFeature_RNA median_negprobes negprobes_quantile_0.75 negprobes_quantile_0.8 negprobes_quantile_0.85 negprobes_quantile_0.9 negprobes_quantile_0.95 negprobes_quantile_0.99 nCount_negprobes nFeature_negprobes median_falsecode falsecode_quantile_0.75 falsecode_quantile_0.8 falsecode_quantile_0.85 falsecode_quantile_0.9 falsecode_quantile_0.95 falsecode_quantile_0.99 nCount_falsecode nFeature_falsecode
Area.um2CenterX_local_pxCenterY_local_pxCenterX_global_pxCenterY_global_pxcellcell_type275 3550 0.66 59 90 315 752 163 1572 2637 9664 213 952 2156 4136 0 2656 0.79 0.83 0.62 232 15.30 c_1_275_564 1 v6 ? Run0 S0 1nM PILOT tissue WTx RNA 1 564 0.0230228 265 454.0 531.0 640.0 822.0 1263.1 4323.96 758 488 82.5 454.0 531.0 640.0 822.0 1263.1 4323.96 0 0 16 454.0 531.0 640.0 822.0 1263.1 4323.96 3 351.120021194854051220844c_1_275_564B cell 1 398 7173 0.90 99 110 246 928 246 3028 3228 14948 410 3504 1822 4544 0 1632 0.74 0.82 0.81 331 21.67 c_1_398_2859 1 v6 ? Run0 S0 1nM PILOT tissue WTx RNA 1 2859 0.0145843 192 327.0 378.0 452.0 572.2 871.1 2696.42 1793 979 81.5 327.0 378.0 452.0 572.2 871.1 2696.42 0 0 11 327.0 378.0 452.0 572.2 871.1 2696.42 2 2103.29123705258193290-2581c_1_398_2859GC B cell 395 5872 0.92 106 98 221 1084 132 1280 1143 10040 173 968 2364 4356 0 2364 0.84 0.72 0.70 320 18.35 c_1_395_1018 1 v6 ? Run0 S0 1nM PILOT tissue WTx RNA 1 1018 0.0155680 197 323.0 372.0 438.0 546.2 821.2 2604.10 1233 707 89.0 323.0 372.0 438.0 546.2 821.2 2604.10 0 0 12 323.0 372.0 438.0 546.2 821.2 2604.10 4 484.5568269695979483-959c_1_395_1018fibroblast reticular cell 1 134 3488 0.84 71 85 638 5128 377 2352 4376 11492 163 824 738 2236 0 1452 0.66 0.75 0.86 241 14.47 c_1_134_897 1 v6 ? Run0 S0 1nM PILOT tissue WTx RNA 1 897 0.0252638 297 501.5 583.0 692.3 888.0 1362.1 4657.00 404 264 104.0 501.5 583.0 692.3 888.0 1362.1 4657.00 0 0 19 501.5 583.0 692.3 888.0 1362.1 4657.00 1 150.227216618504005446075c_1_134_897fibroblast reticular cell 2 239 3634 0.96 72 75 296 1128 98 764 933 7048 577 3364 1197 3336 0 2060 0.81 0.86 0.54 231 15.73 c_1_239_237 1 v6 ? Run0 S0 1nM PILOT tissue WTx RNA 1 237 0.0143836 224 387.0 447.4 529.0 671.2 1017.3 3100.50 549 364 85.5 387.0 447.4 529.0 671.2 1017.3 3100.50 0 0 14 387.0 447.4 529.0 671.2 1017.3 3100.50 1 152.329621652379175029624c_1_239_237CD4 T cell 8 2388 0.92 57 62 1928 2512 698 1420 7264 17028 480 1120 3030 4016 0 2048 1.00 0.86 0.93 187 12.77 c_1_8_806 1 v6 ? Run0 S0 1nM PILOT tissue WTx RNA 1 806 0.0395541 244 420.0 485.0 575.0 741.0 1113.1 3242.56 564 349 81.5 420.0 485.0 575.0 741.0 1113.1 3242.56 0 0 24 420.0 485.0 575.0 741.0 1113.1 3242.56 4 434.3872104417472663983572c_1_8_806B cell 3 5 1296 0.95 41 39 1760 2484 825 5600 11495 22772 452 956 4048 5088 0 1296 0.95 1.03 0.89 126 10.29 c_1_5_2230 1 v6 ? Run0 S0 1nM PILOT tissue WTx RNA 1 2230 0.0415350 227 371.5 423.0 507.0 641.0 968.1 2931.02 226 169 66.0 371.5 423.0 507.0 641.0 968.1 2931.02 0 0 14 371.5 423.0 507.0 641.0 968.1 2931.02 0 018.6624263832711543582048c_1_5_2230NA 341 1687 0.82 42 51 128 724 208 2136 759 5304 108 1624 2004 3540 0 1452 0.83 0.93 0.77 151 11.17 c_1_341_2806 1 v6 ? Run0 S0 1nM PILOT tissue WTx RNA 1 2806 0.0180755 265 461.5 542.4 656.3 863.0 1324.0 4247.52 599 384 81.0 461.5 542.4 656.3 863.0 1324.0 4247.52 0 0 21 461.5 542.4 656.3 863.0 1324.0 4247.52 1 124.292824592149323206382c_1_341_2806B cell 3 45 2528 0.58 47 81 196 808 102 788 3561 15640 318 888 1672 3096 0 1912 0.53 0.82 0.56 197 12.83 c_1_45_344 1 v6 ? Run0 S0 1nM PILOT tissue WTx RNA 1 344 0.0157915 399 692.0 804.0 953.3 1226.0 1843.1 5699.50 750 476 107.0 692.0 804.0 953.3 1226.0 1843.1 5699.50 0 0 29 692.0 804.0 953.3 1226.0 1843.1 5699.50 1 136.403214792421854268013c_1_45_344B cell 2 66 1955 0.92 55 60 310 864 82 1284 2736 7688 389 1728 1990 3160 0 1316 0.80 0.73 0.68 183 10.68 c_1_66_2084 1 v6 ? Run0 S0 1nM PILOT tissue WTx RNA 1 2084 0.0260545 366 660.0 767.0 934.3 1212.0 1852.0 5709.46 443 290 102.5 660.0 767.0 934.3 1212.0 1852.0 5709.46 0 0 24 660.0 767.0 934.3 1212.0 1852.0 5709.46 2 228.1520330116705022662319c_1_66_2084B cell 2 Table 4.7: Description of the baseline metadata file format for AtoMx SIP v1.3.2. Column Name Type Description fov Int The field of view (FOV) number. Area Int Number of pixels assigned to a given cell. AspectRatio float Width divided by height. Width Int Cell’s maximum length in x dimension (pixels). Height Int Cell’s maximum length in y dimension (pixels). Mean.(IF) Int The mean fluorescence intensity for a given cell. Max.(IF) Int The max fluorescence intensity for a given cell. SplitRatioToLocal float If cell abuts the FOV border: the ratio of Area to mean cell area for that FOV. If cell does not border the FOV boundary: 0. NucArea Int Number of pixels assigned to a given nucleus. NucAspectRatio float Width divided by height of nucleus. Circularity float Area to perimeter ratio. 1 = circle; < 1 less circular [@Fu2024]. Eccentricity float A cell’s minor axis divided by its major axis [@Fu2024]. Perimeter Int The perimeter of the cell (in pixels) Solidity float The Area of the cell divided by its convex area. A measure of the “density” of a cell with values < 1 indicating increased cell irregularity [@Fu2024] cell_id string A study-wide unique cell identifier. Combination of c(ell), slide_ID, fov, and cell_ID. Note that this is equivalent to cell_ID in napari-cosmx. X int (Invariable constant) version string The version of the target decoding used. dualfiles string (Invariable constant) Run_name string (Invariable constant) Run_Tissue_name string The name of the slide. ISH.concentration string Concentration Dash string (Invariable constant) Tissue string (Invariable constant) Panel string Experimental Panel (pre-commercial) assay_type string Assay type slide_ID Int Unique identifier for the slide. cell_ID Int Unique identifier for a single cell within a given FOV. To make a unique identifier for a cell within the whole sample use both the fov and cell_ID columns. unassignedTranscripts float Proportion of transcripts in the FOV the cell resides in that are not assigned within any cell. This value is an FOV-level metric that is repeated for each cell (excluding cell 0). median_RNA float FOV-level statistic. Median RNA target probe expression across all cells within a given FOV. RNA_quantile_(proportion) float FOV-level statistic. The (proportion*100) percentile of RNA target expression across all cells within a given FOV. nCount_RNA Int Total RNA transcripts observed. nFeature_RNA Int Total number of unique RNA transcripts observed. median_negprobes float FOV-level statistic. Median negative probe expression across all cells within a given FOV. negprobes_quantile_(proportion) float FOV-level statistic. The (proportion*100) percentile of negative probe expression across all cells within a given FOV. nCount_negprobes Int Total Negative Control Probe counts observed. nFeature_negprobes Int Total number of unique Negative Control Probe counts observed. median_falsecode float FOV-level statistic. Median System Control counts across all cells within a given FOV. falsecode_quantile_(proportion) float FOV-level statistic. The (proportion*100) percentile of System Control counts across all cells within a given FOV. nCount_falsecode Int Total System Control codes counts observed. These codes do not have a physical probe in the experiment. nFeature_falsecode Int Total number of unique System Control codes counts observed. Area.um2 float The cell area in units of μm2 CenterX_local_px Int The x position of this cell within the FOV, measured in pixels. The pixel edge length is 120 nm. Thus, to convert to microns multiply the pixel value by 0.12028 μm per pixel. CenterY_local_px Int Same as CenterX_local_px but for the y dimension. CenterX_global_px float See CenterX_global_px description. The global positions describes the relative position of this cell within the large sample reference frame. CenterY_global_px float Same as CenterX_global_px but for the y dimension. cell string Redundant with cell_id cell_type string Cell Type -
4.4 FOV positions
Table 4.8: First 10 FOV positions in S0_fov_positions_file.csv.gz. FOV x_global_px y_global_px x_global_mm y_global_mm 1 13824 89585 1.6589148 10.750230 2 18090 89585 2.1708305 10.750230 3 22356 89585 2.6827462 10.750230 4 8531 85319 1.0238314 10.238314 5 12797 85319 1.5357471 10.238314 6 17063 85319 2.0476628 10.238314 7 21329 85319 2.5595785 10.238314 8 25595 85319 3.0714942 10.238314 9 29861 85319 3.5834099 10.238314 10 5035 81053 0.6042915 9.726398 Table 4.9: Description of the baseline FOV file format for AtoMx SIP v1.3.2. Column Name Type Description FOV Int The field of view (FOV) number x_global_px float The x location (in pixels) of the FOV relative to other FOVs y_global_px float The y location (in pixels) of the FOV relative to other FOVs x_global_mm float The x location (in millimeters) of the FOV relative to other FOVs y_global_mm float The y location (in millimeters) of the FOV relative to other FOVs -
4.5 Polygons
Table 4.10: All of the verteces for cell c_1_1_1 in S0-polygons.csv.gz. fov cellID cell x_local_px y_local_px x_global_px y_global_px 1 1 c_1_1_1 8395 4986 22238.94 84587.57 1 1 c_1_1_1 8387 5013 22230.93 84560.51 1 1 c_1_1_1 8313 5019 22156.75 84554.50 1 1 c_1_1_1 8302 5016 22145.73 84557.50 1 1 c_1_1_1 8288 5009 22131.69 84564.52 1 1 c_1_1_1 8287 5006 22130.69 84567.52 1 1 c_1_1_1 8286 4999 22129.69 84574.54 1 1 c_1_1_1 8286 4998 22129.69 84575.54 1 1 c_1_1_1 8287 4979 22130.69 84594.59 1 1 c_1_1_1 8288 4974 22131.69 84599.60 1 1 c_1_1_1 8291 4965 22134.70 84608.63 1 1 c_1_1_1 8294 4959 22137.71 84614.63 1 1 c_1_1_1 8306 4947 22149.74 84626.67 1 1 c_1_1_1 8312 4943 22155.75 84630.67 1 1 c_1_1_1 8318 4940 22161.76 84633.68 1 1 c_1_1_1 8327 4937 22170.78 84636.69 1 1 c_1_1_1 8332 4936 22175.80 84637.69 1 1 c_1_1_1 8341 4936 22184.82 84637.69 1 1 c_1_1_1 8346 4937 22189.83 84636.69 1 1 c_1_1_1 8354 4939 22197.85 84634.69 1 1 c_1_1_1 8363 4942 22206.87 84631.67 1 1 c_1_1_1 8369 4945 22212.88 84628.67 1 1 c_1_1_1 8380 4956 22223.91 84617.65 1 1 c_1_1_1 8384 4962 22227.92 84611.63 1 1 c_1_1_1 8392 4976 22235.94 84597.60 1 1 c_1_1_1 8393 4978 22236.94 84595.59 1 1 c_1_1_1 8394 4981 22237.94 84592.59 Table 4.11: Description of the baseline polygons file format for AtoMx SIP v1.3.2. Column Name Type Description fov Int The field of view (FOV) number. cell_ID Int Unique identifier for a single cell within a given FOV. To make a unique identifier for a cell within the whole sample use both the fov and cell_ID columns. cell string A study-wide unique cell identifier. Combination of c(ell), slide ID, and cell_ID. Note that this is equivalent to cell_ID in napari-cosmx. x_local_px float The x position (in pixels) of vertex relative to the given FOV. y_local_px float The y position (in pixels) of vertex relative to the given FOV. x_global_px float The x position (in pixels) of vertex relative to the tissue. y_global_px float The y position (in pixels) of vertex relative to the tissue. -
5 Appendix
Figure 5.1: Description and conclusion from pathologist’s report.
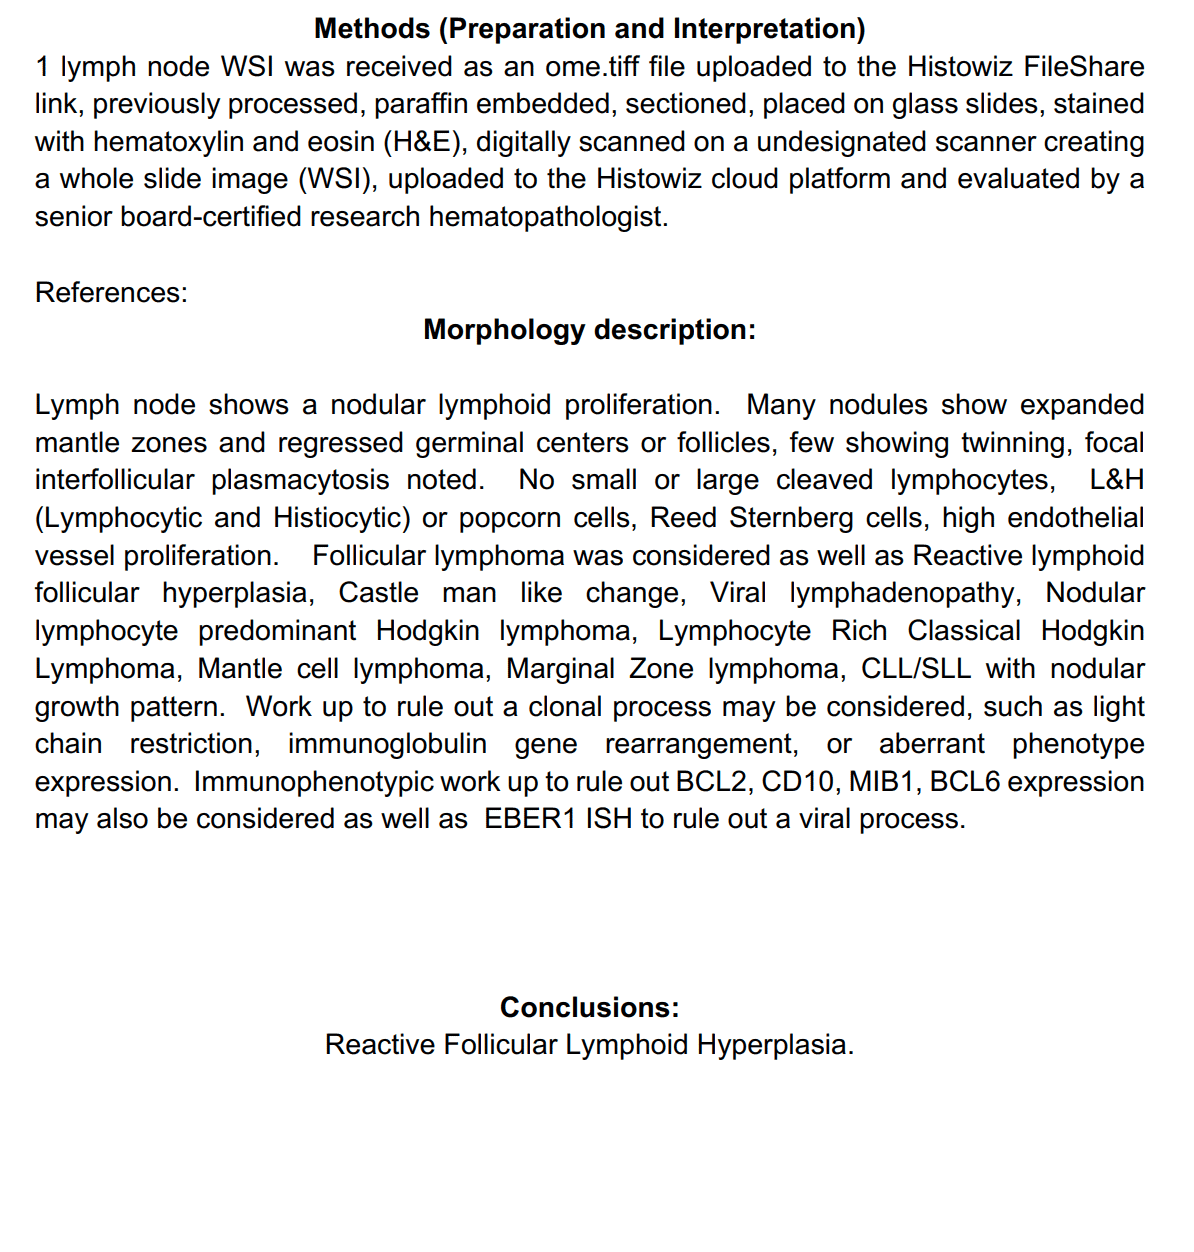
- A serial section (H&E) was sent to Histowiz for evaluation where it was determined to be a reactive follicular lymphoid hyperplasia sample (see Appendix).↩︎
- FFPE block was obtained from Acepix Biosciences ↩︎
Figure 5.2: Lymph node with nodular lymphoid proliferation, entire field, yellow circle, 0.3x magnification.
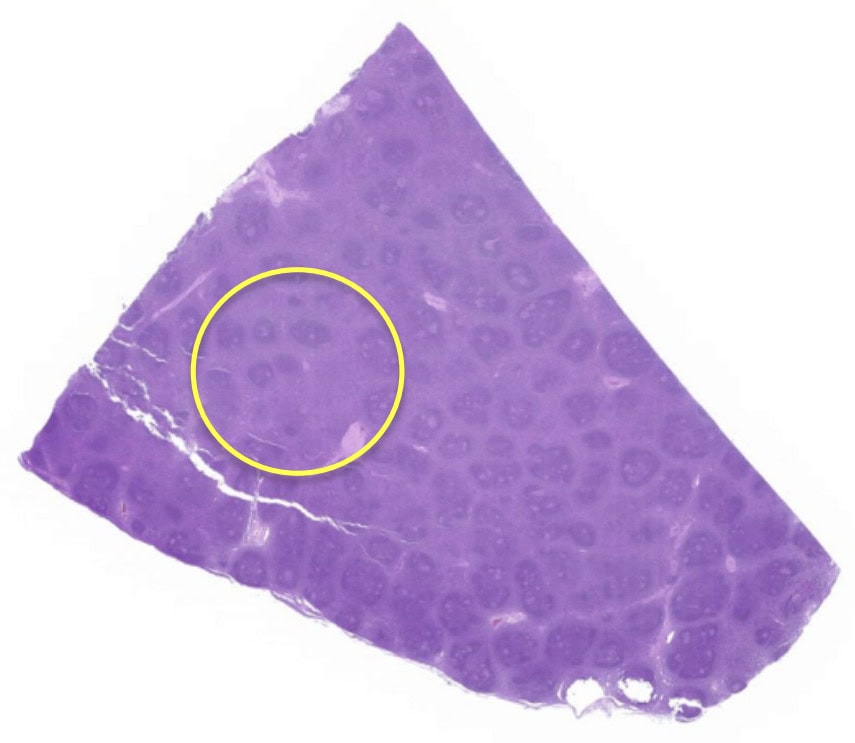
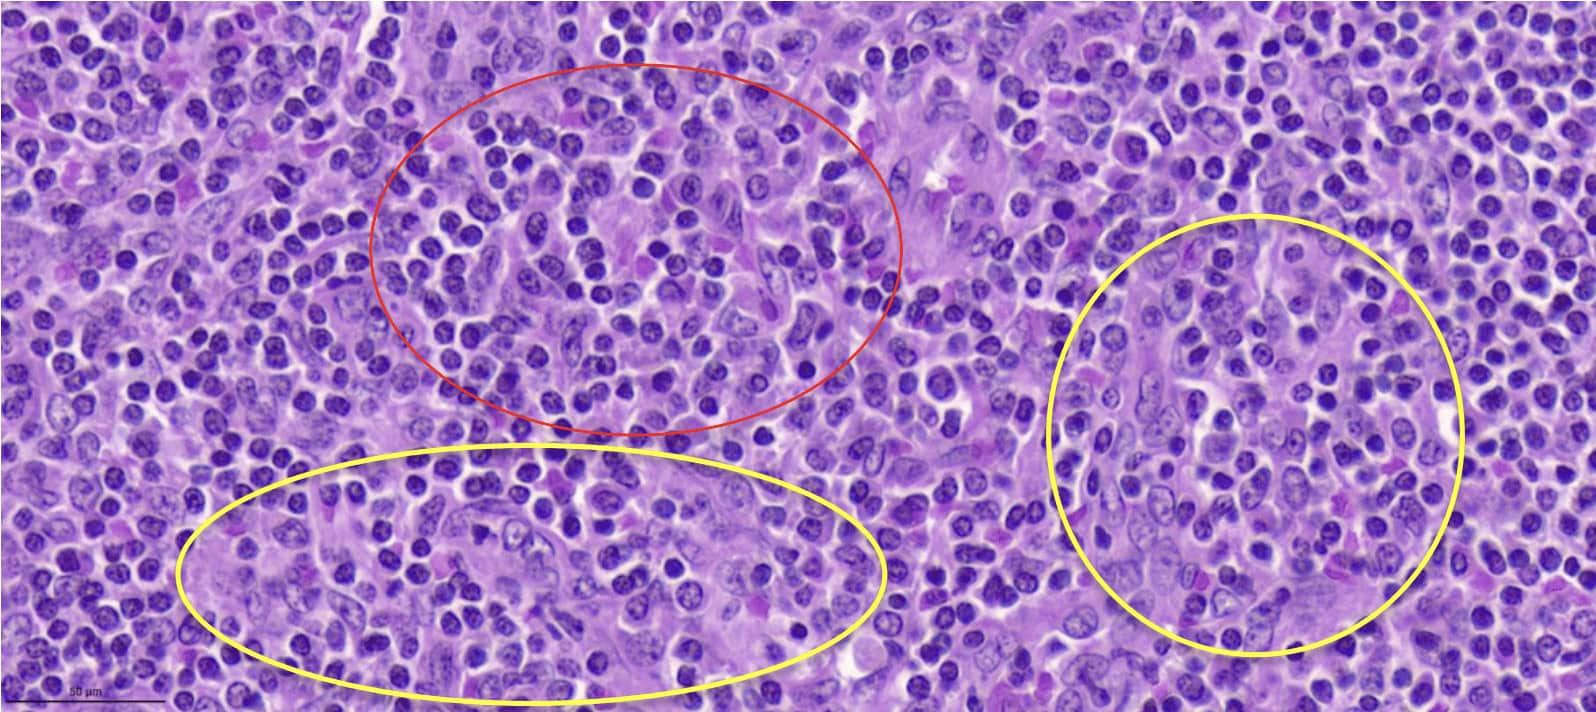
Figure 5.3: Lymph node with regressed germinal centers, red circles, focal twinning, yellow circle, 3.7x magnification
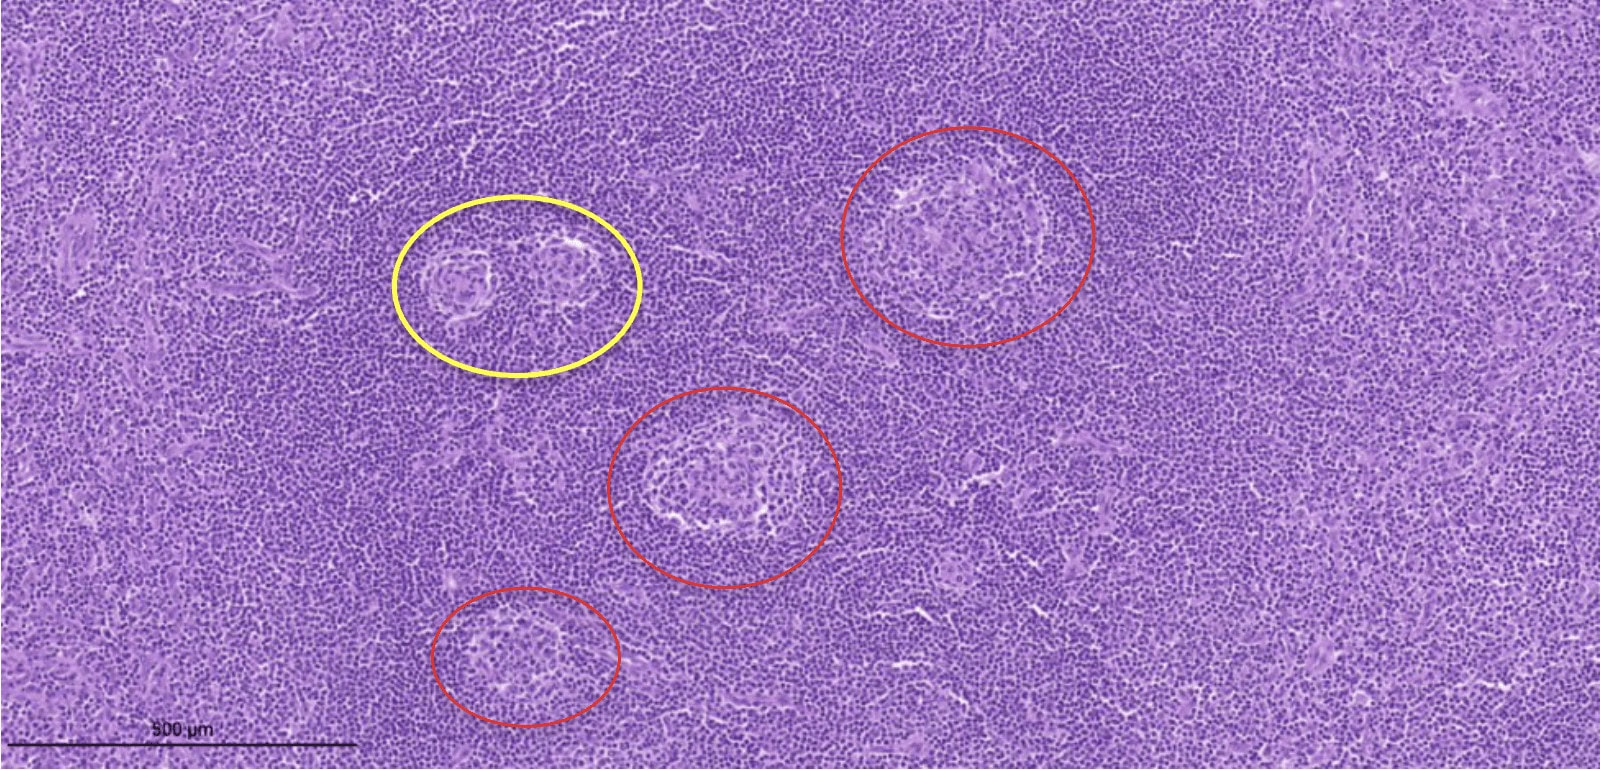
Figure 5.4: Lymph node with regressed germinal centers, yellow circle, expanded mantle zone, red circle, 6.5x magnification
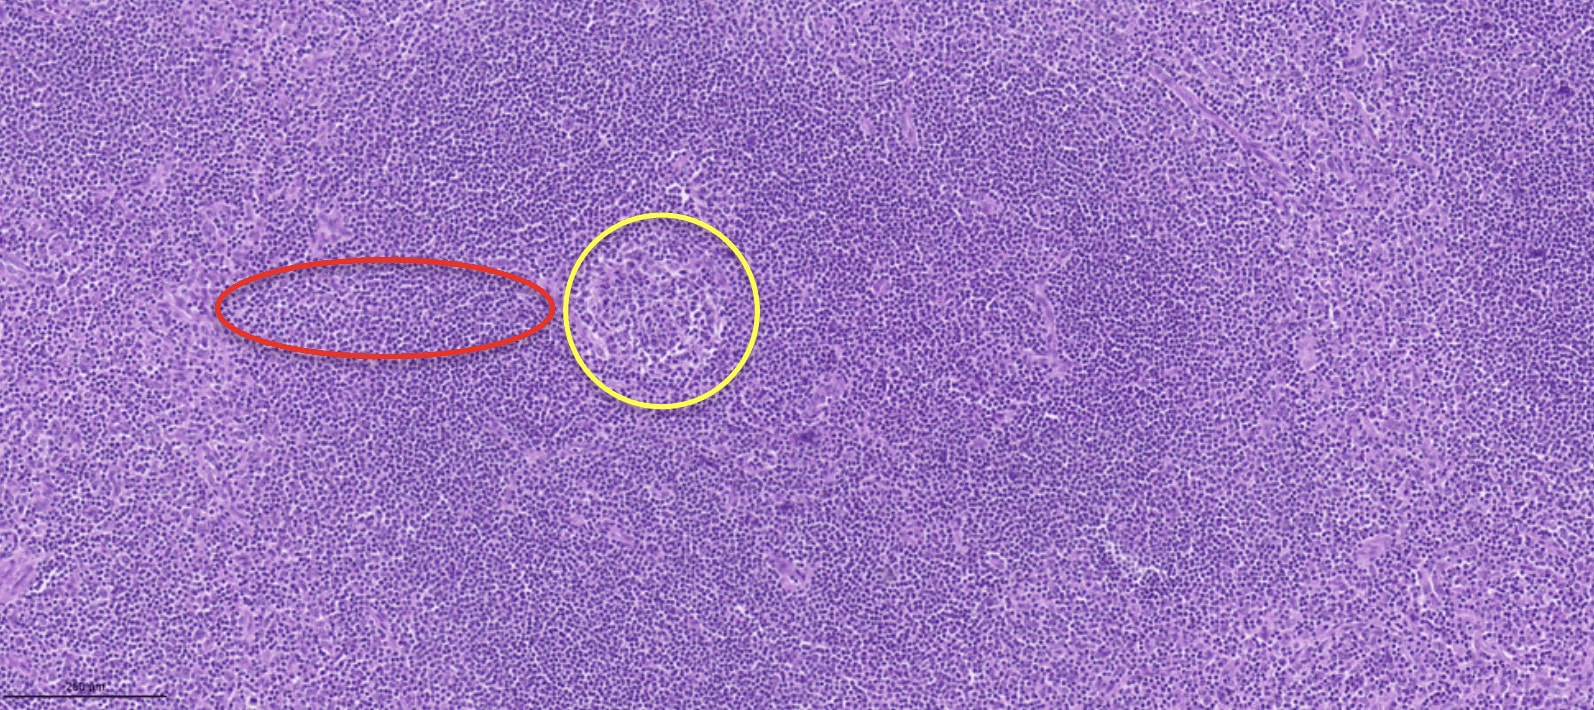
Figure 5.5: Lymph node with regressed germinal centers, twinning, yellow circle, 40x magnification.
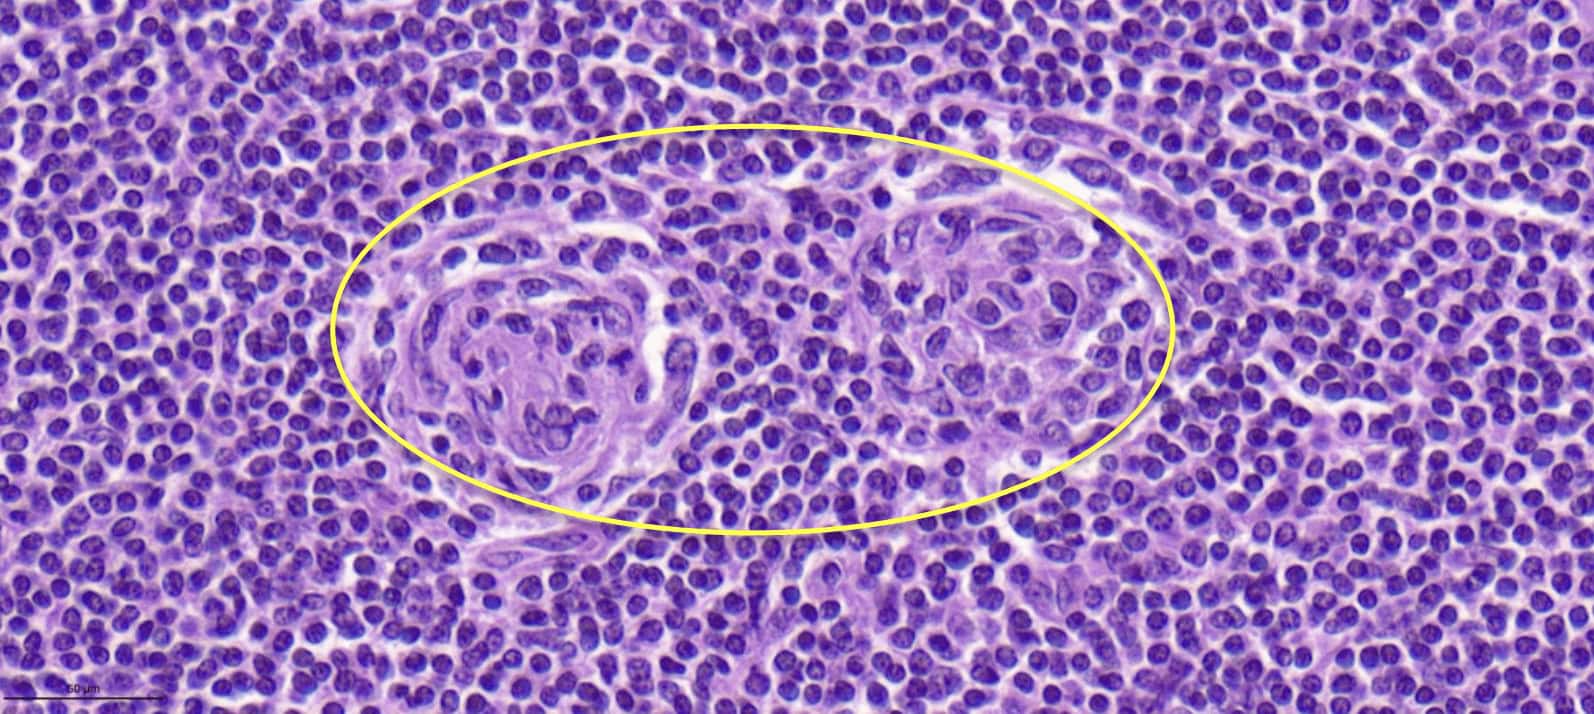
Figure 5.6: Lymph node with interfollicular plasmacytosis, red circle, small vessel proliferation, yellow circles, 40x magnification.