CosMx SMI Human Liver FFPE Dataset
Discover More from Precious FFPE Samples
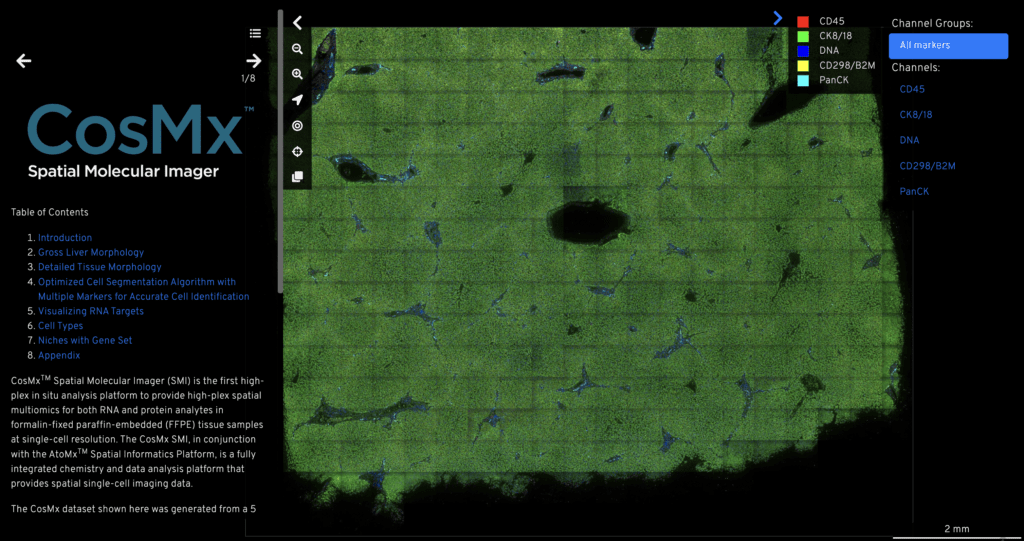
Using CosMx™ SMI, we characterize liver FFPE tissue from normal and hepatocellular carcinoma patients and generated open-source dataset. This data showcases the best-in-class data quality of the CosMx SMI. The dataset highlights CosMx SMI’s high sensitivity, with the capability to detect and quantify an average of 1,150 transcripts per cell and to maximize biological insights by detecting 676 genes. The dataset also represents CosMx SMI’s high specificity, with more than 99% of identified counts on targeted genes.
The CosMx SMI human liver data provides a subcellular expression map of 1,000 genes and a single cell tissue atlas that categorizes each cell in the tissue as one of 18 unique cell types. The complete dataset consists of over 800,000 single cells and ~700 million transcripts, and a single-cell tissue atlas across a ~180 mm2 area of liver tissue. The high-plex analysis provided deep insight into the cell and tissue changes that occur in cancer, including infiltration of diverse immune cells.
The CosMx™ SMI and decoder probes are not offered and/or delivered to the Federal Republic of Germany for use in the Federal Republic of Germany for the detection of cellular RNA, messenger RNA, microRNA, ribosomal RNA and any combinations thereof in a method used in fluorescence in situ hybridization for detecting a plurality of analytes in a sample without the consent of the President and Fellows of Harvard College (Harvard Corporation) as owner of the German part of EP 2 794 928 B1. The use for the detection of cellular RNA, messenger RNA, microRNA, ribosomal RNA and any combinations thereof is prohibited without the consent of the President and Fellows of Harvard College (Harvard Corporation).
How it Works
This dataset was generated using the CosMx Human Universal Cell Characterization RNA panel. This panel is fully validated and designed to provide robust tissue mapping, cell typing and analysis of cell states across a wide range of tissues and disease states.

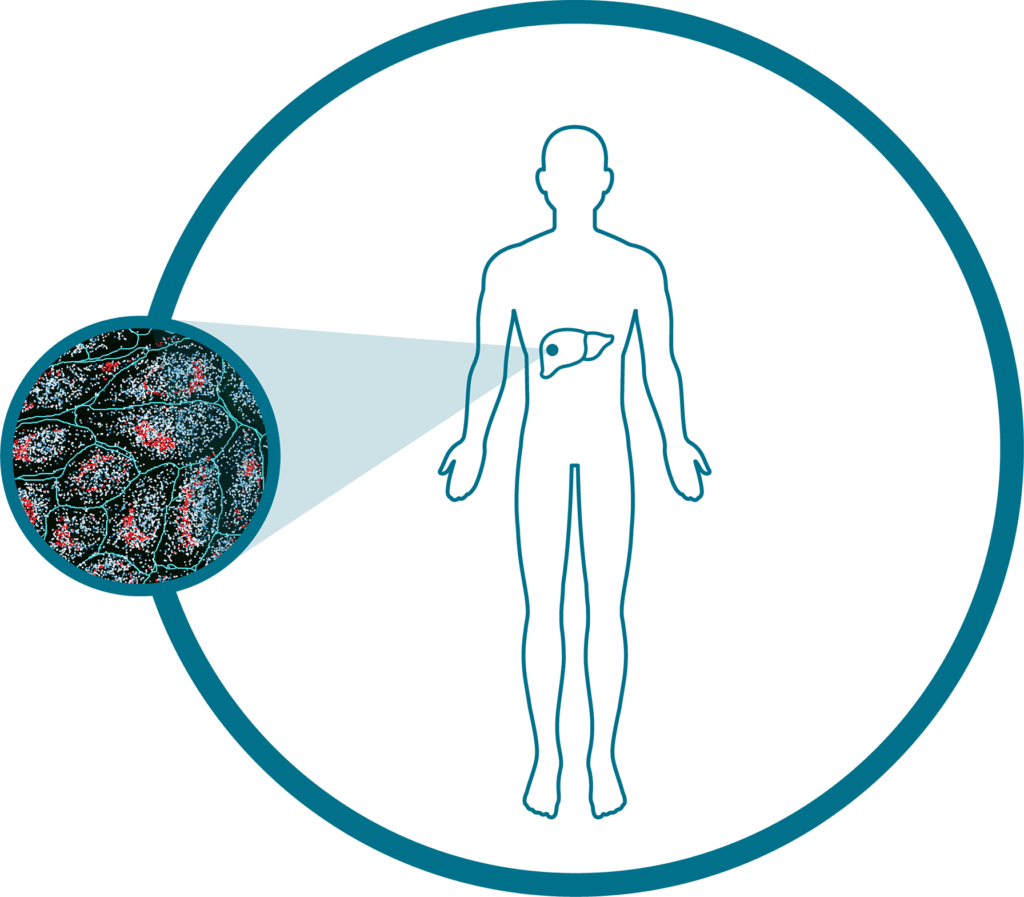
This dataset contains one sample each from normal liver and hepatocellular carcinoma tissues.
Normal Liver
- Sex: M
- Race: Caucasian
- Age: 35
Hepatocellular Carcinoma
- Sex: F
- Race: Caucasian
- Age: 65
- Grade: G3
- Stage: II
All Data Files
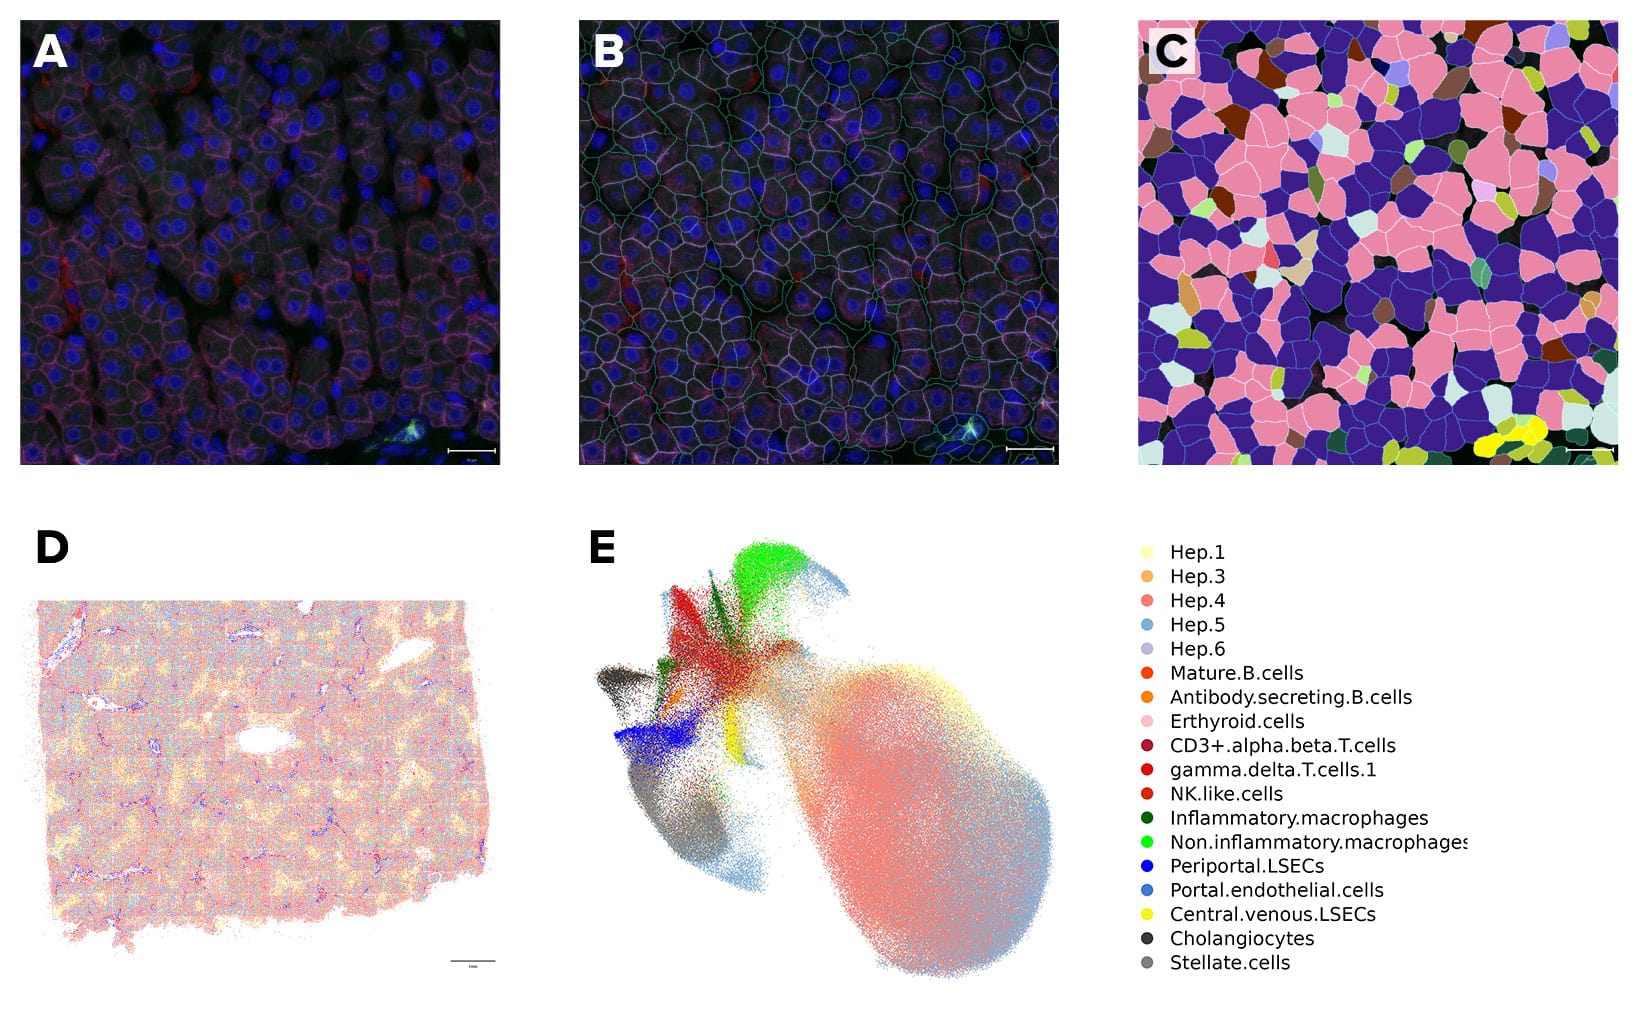
Discover and Map Cell Types
The CosMx Human Universal Cell Characterization panel delivers expression mapping of 1000 target genes in a morphologically intact tissue. In addition to mapping RNA targets, CosMx SMI uses cell membrane protein images, machine-learning and transcript-based segmentation to achieve precise single-cell boundary detection and subcellular segmentation of tissue. Taken together, this creates a spatial cell atlas of normal liver tissue by identifying 18 different cell types , their spatial locations and subcellular expression mapping of 1000 genes.
Phenotyping of the Tissue Microenvironment
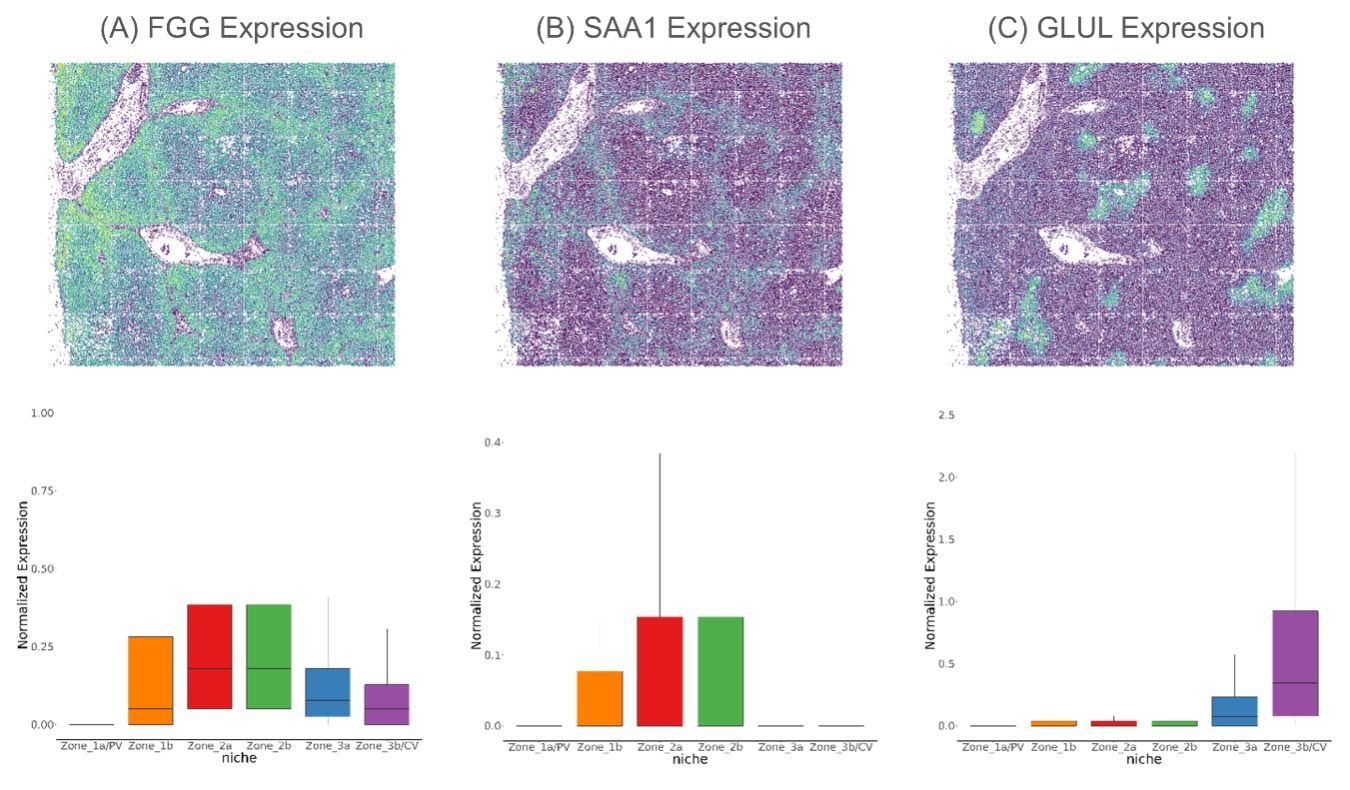
Spatial location of cell types enables characterization of the tissue microenvironment. Based on analysis of each cell’s 200 closest neighbors, six distinct well-defined neighborhood clusters or niches are identified in normal liver tissue, including the Portal vein (PV), Central vein (CV) and the three functional zones of the liver (Zones 1-3).
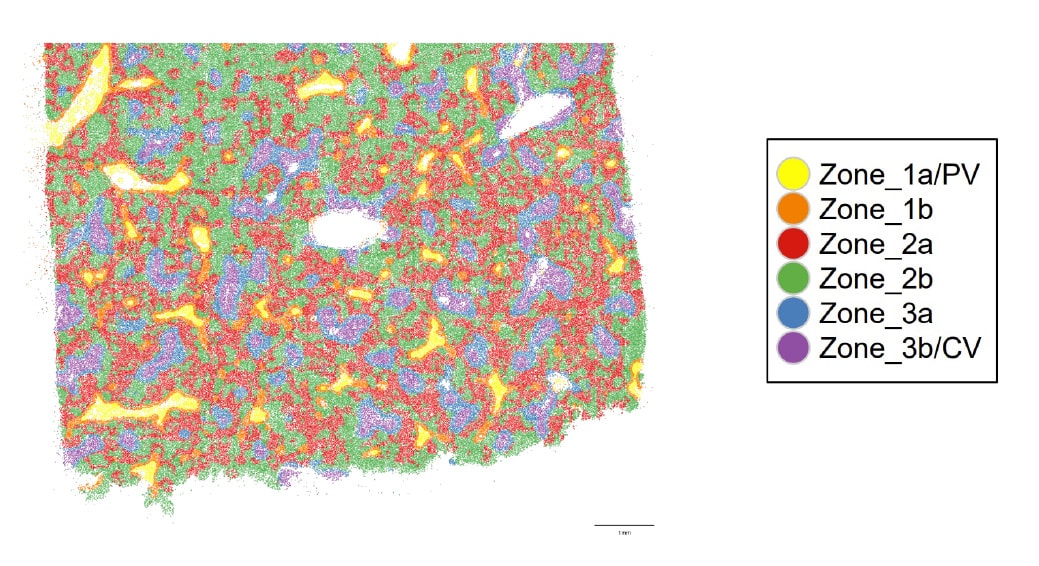
This level of neighborhood analysis enables researchers to examine how gene expression changes across these different liver regions. Here we can visualize how FGG (A), SAA1 (B) and GLUL (C) expression differs from each liver region.
Understanding the Disease State
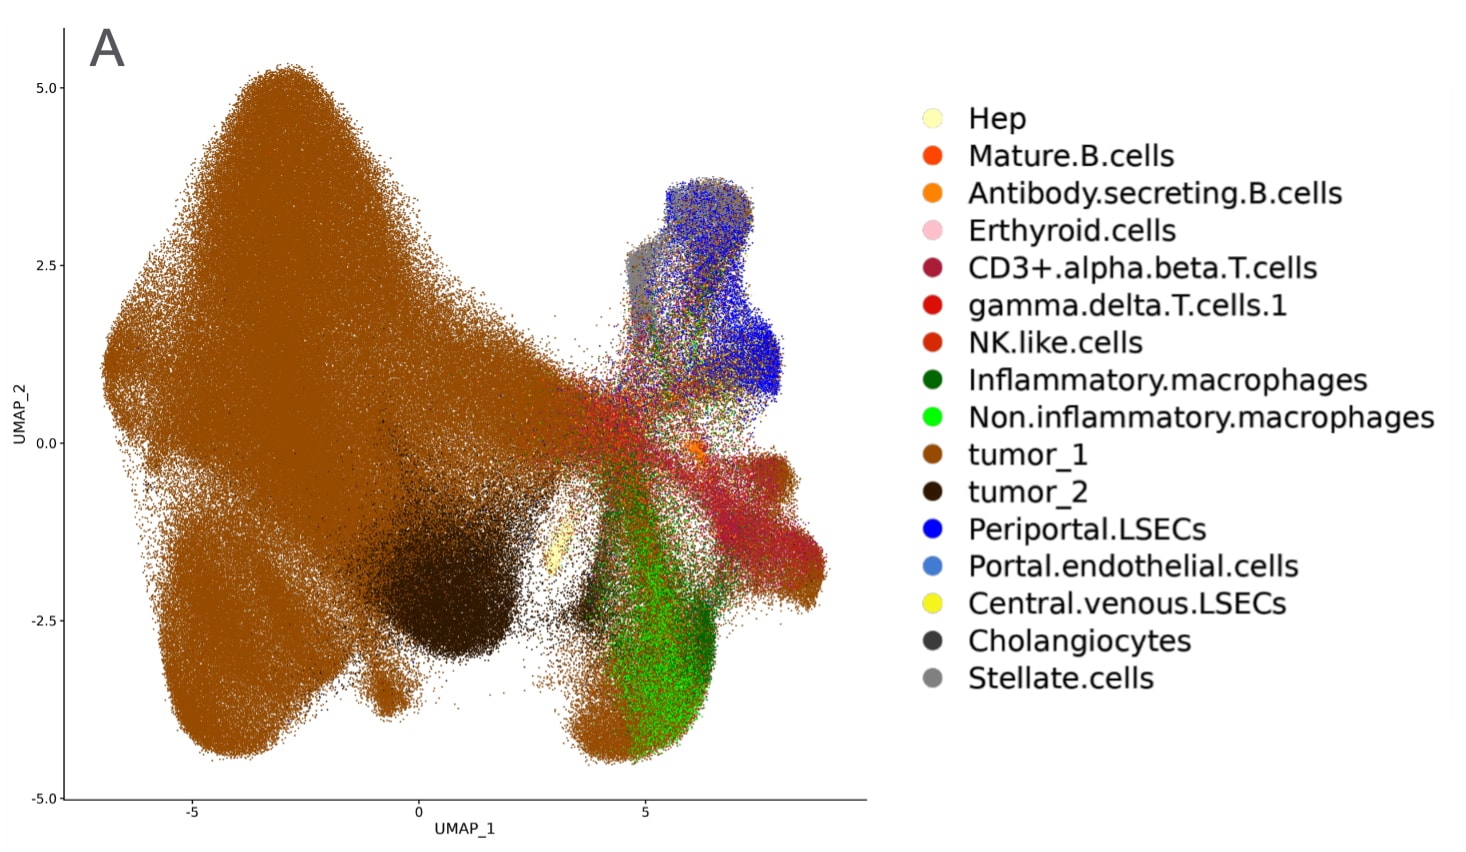
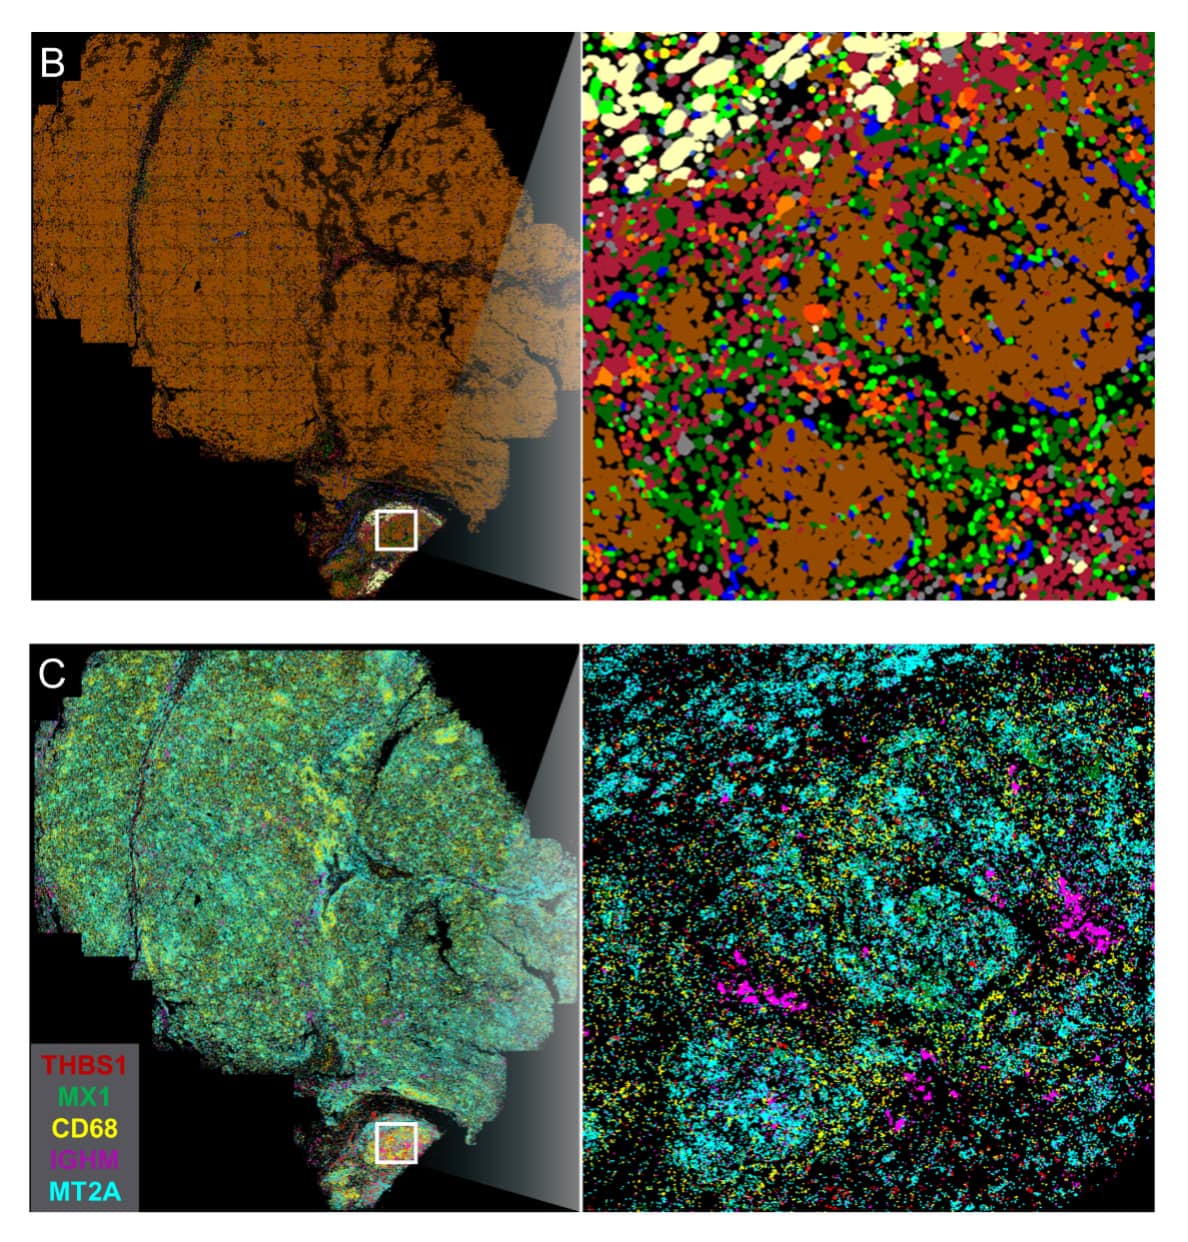
Spatial visualization and molecular quantification of mRNA targets enable deep insight into the tissue organizational changes that occur in cancer. Imaging cancerous liver tissue with CosMx SMI provides Cell Type UMAP (A) analysis. XY visualization of cell types provides spatial discovery into regions of the tumor linked with immune infiltration (B) and mRNA expression of specific targets of interest in immune infiltrate region (C).
Request a Quote
Contact our helpful experts and we’ll be in touch soon.

Technology Publication:
High-Plex Multiomic Analysis in FFPE Tissue at Single-Cellular and Subcellular Resolution by Spatial Molecular Imaging