Gain a More Complete Picture of Biology with Spatial Multiomics
Simultaneously spatially profile thousands of transcripts and hundreds of proteins from the same formalin-fixed, paraffin-embedded (FFPE) tissue section using true, same-slide spatial multiomics with the GeoMx Digital Spatial Profiler (DSP). The 570+ plex GeoMx® IO Proteome Atlas can be combined with either the GeoMx® Human Whole Transcriptome Atlas or GeoMx® Cancer Transcriptome Atlas to maximize your discovery power and get you a more complete picture of biology.
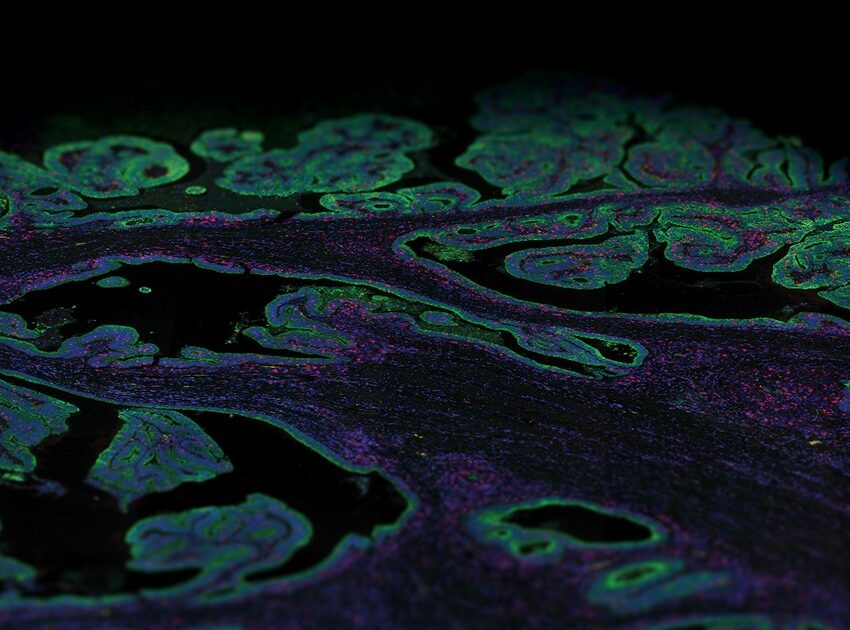
GeoMx DSP lets you decide where to draw the line and which cell types and tissue structures to enrich for with morphology marker guided region of interest (ROI) selection. Use a four-color fluorescent stain to image the tissue, mark the regions of the tissue that are of most interest to you, and profile RNA and protein expression simultaneously from each ROI.
Lay out geometric ROIs to sample the heterogeneity of the tissue in different hotspots, use amorphous shaped ROIs to follow the boundaries of specific tissue structures, or even segment one ROI into two or more tissue compartments based on the staining pattern. You can even place concentric ring-shaped ROIs at different distances around a central feature or boundary to study the effect of proximity on RNA and protein expression.
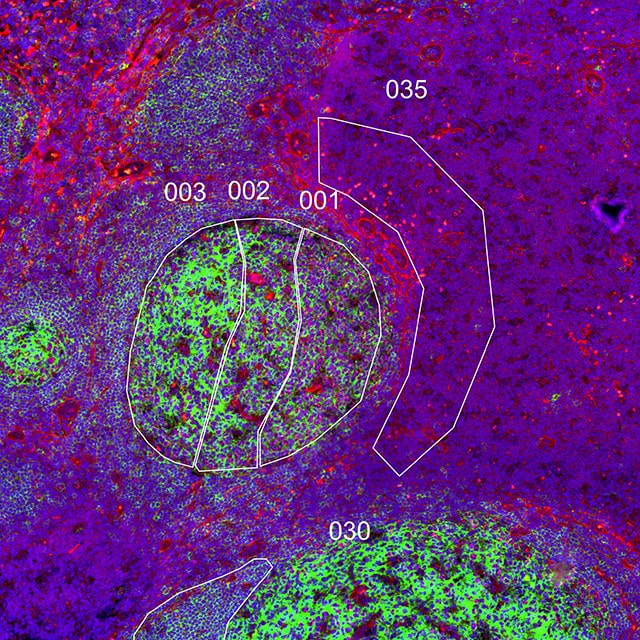
Geometric Profiling
What is the heterogeneity of expression in different regions of my tissue?
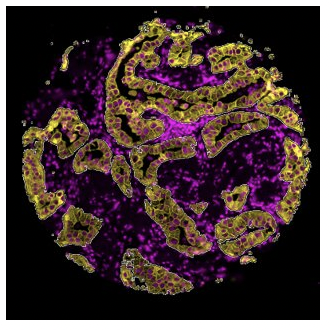
Segmentation
What is the expression profile of distinct biological compartments (e.g., Tumor-TME)?
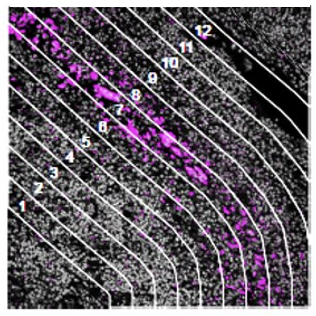
Contour
How does the immune environment change on either side of an infiltrate boundary?
How Does Spatial Multiomics Work with GeoMx DSP?
GeoMx DSP seamlessly fits in with your current histology workflow without any specialized slides and can easily be scaled up for large cohort spatial multiomic studies with automated staining using the BOND RX Automated Research Stainer from Leica Biosystems. Simply stain the tissue with up to four fluorescently labeled antibodies or in situ hybridization (ISH) probes for visualization as morphology markers, add oligonucleotide-barcoded probes for simultaneous detection of RNA and protein, image, and select ROIs for downstream analysis.
Selected ROIs are illuminated with UV light, releasing the indexing barcodes that are then sequenced and counted on an Illumina Next-Generation Sequencer (NGS) system for mapping expression of individual RNAs and proteins back to each ROI. Updated probe chemistry enables same-slide co-detection of RNA and protein for the same sequencing depth and cost as separate detection with serial sections.

Featured Solutions for Spatial Multiomics
To enable spatial multiomics with GeoMx DSP, you can choose to add the GeoMx IO Proteome Atlas (IPA) to the GeoMx Human Whole Transcriptome Atlas (WTA) or the Cancer Transcriptome Atlas (CTA). The GeoMx Human WTA lets you spatially profile upwards of 18,000 protein-coding genes and can be customized with up to 400 probes of your choice. The CTA contains probes for over 1,800 RNA targets involved in the development and progression of cancer as well as the immune response.
The GeoMx IPA contains nearly all Abcam’s catalog of IO related antibodies and lets your profile the expression of over 570 proteins relevant to immuno-oncology research. The GeoMx WTA and IPA work equally well when used separately on serial sections or together on the same slide, allowing you to maximize discovery power and get the most biological information out of every FFPE sample.
IPA Assay Performance Remains Consistent from IPA alone to IPA+WTA


Want to Learn More?
Fill out the form below and a representative will be in touch.

Related Resources