CosMx SMI
NSCLC FFPE Dataset
Discover More from Precious FFPE Samples

Using a CosMx™ SMI prototype, we generated this open-source dataset from eight FFPE non-small-cell lung cancer (NSCLC) tissue samples to highlight the power of spatial molecular imaging.
The CosMx SMI platform, shipping now, combines superior sensitivity, specificity, robust cell segmentation and high plex panels to enable researchers to perform Cell Atlasing / Cell Typing, Biomarker Discovery and Ligand-Receptor Interaction.
The CosMx™ SMI and decoder probes are not offered and/or delivered to the Federal Republic of Germany for use in the Federal Republic of Germany for the detection of cellular RNA, messenger RNA, microRNA, ribosomal RNA and any combinations thereof in a method used in fluorescence in situ hybridization for detecting a plurality of analytes in a sample without the consent of the President and Fellows of Harvard College (Harvard Corporation) as owner of the German part of EP 2 794 928 B1. The use for the detection of cellular RNA, messenger RNA, microRNA, ribosomal RNA and any combinations thereof is prohibited without the consent of the President and Fellows of Harvard College (Harvard Corporation).
How it Works
This dataset was generated with a 960-plex CosMx RNA panel run on a CosMx SMI instrument prototype. CosMx RNA Assays go beyond simple cell typing to deconvolution of multiple tissue types and key aspects of cell signaling and cell state, with a focus on ligands and receptors that enable communication between cells.

This data set contains 8 different samples from 5 NSCLC tissues
- Sex: 3 female, 2 male
- Race: White
- Age: 60+
- Grade: G1-G3
- Stage: 4 IIIA, 1 IIB
* Note: Non-Small Cell Lung Cancer data was collected on a prototype of CosMx SMI. See Liver FFPE Dataset for data collected on the commercially available CosMx SMI.
All Data Files
Individual Datasets
Discover and Map Cell Types
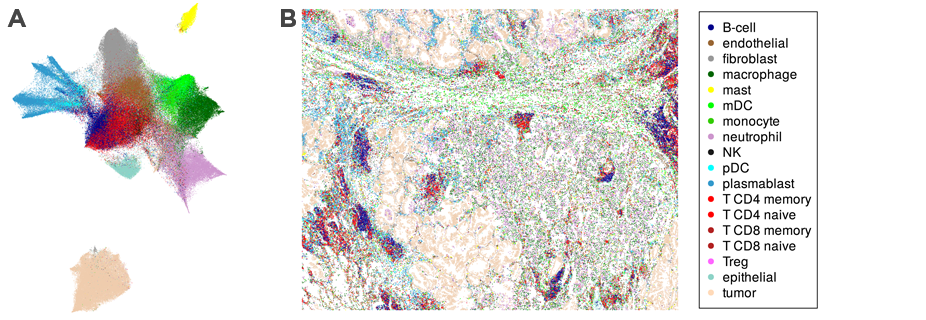
Data from CosMx SMI create a comprehensive spatial cell atlas of tissues by defining the subcellular expression map of 960 genes, identifying 18 different cell types, including four sub-types of T-cells, and mapping cell types across FFPE tissue sections.
Phenotyping of the Tissue Microenvironment
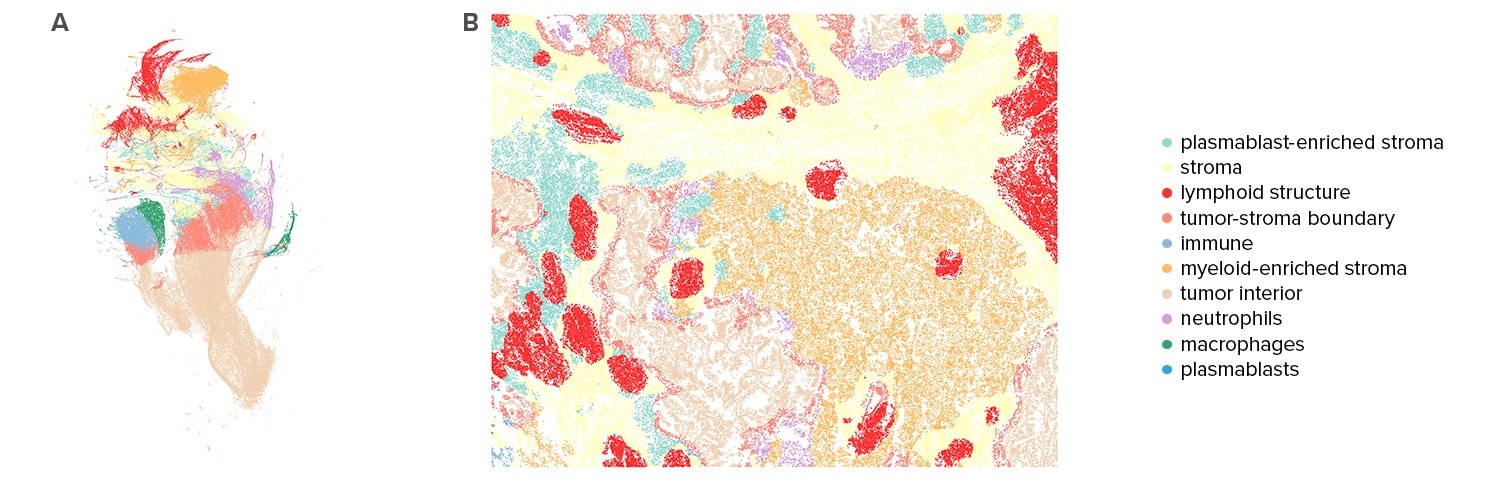
Spatial location of cell types enables characterization of the tissue microenvironment. Based on analysis of each cell’s 200 closest neighbors, CosMx SMI data partitions tissues into distinct neighborhood clusters or niches. Analysis of these neighborhoods reveal how some neighborhoods are specific to a single tissue, while others are shared across all tissues analyzed.
In-Depth Characterization of the Tumor Microenvironment
CosMx SMI data allows tumor characterizations not just by gene expression, cell types, and spatial features, like niches, but also by the tendency of immune cells to invade into the tumor. As an example, the NSCLC dataset indicates macrophages in Lung 6 tissue are primarily surrounded by non-tumor cells, while mast cells are more likely to be surrounded by tumor cells.

Differential Expression Pattern of a Cell Type Based on Spatial Location
The data can be used to analyze changes in gene expression patterns of any given cell type based on spatial context as shown here with macrophages. For example, within the NSCLC dataset, macrophages express more SPP1 in the tumor interior and tumor-stroma boundary than they do in more immune-rich settings.

Ligand Receptor Analysis
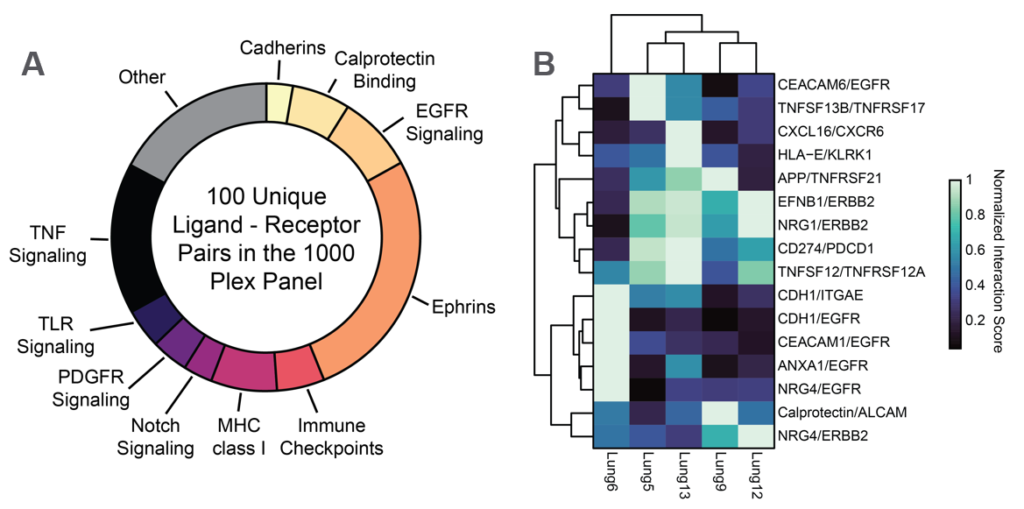
CosMx SMI enables analysis for the enrichment of pairwise ligand-receptor expression between interacting cell types. When examining the NSCLC dataset, of these, 16 were significantly enriched at the interface between tumor cells and T cells. Interestingly one of these pairs, the immune checkpoint PD-L1/PD-1 (CD74/PDCD1), exhibited a high degree of variation in Tumor to T cell co-expression.
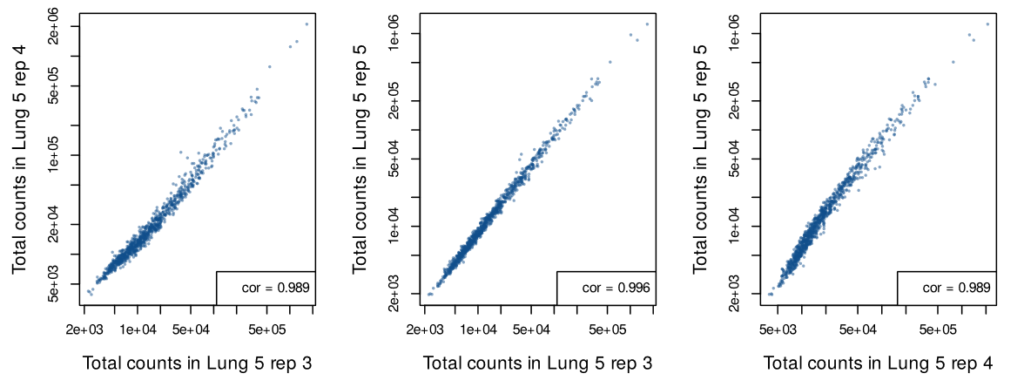
Detect with Confidence
Single cell in situ data was generated from three serial sections of the “Lung 5” sample. While these three FFPE sections include different cells, they capture the same regions of the tumor microenvironment. The analysis of these three replicates shows high correlation between each section, indicating a high level of reproducibility.
Request a Quote
Contact our helpful experts and we’ll be in touch soon.

Technology Publication:
High-Plex Multiomic Analysis in FFPE Tissue at Single-Cellular and Subcellular Resolution by Spatial Molecular Imaging