Visiopharm Partnership
AI-Driven Precision Pathology Meets Spatial Biology
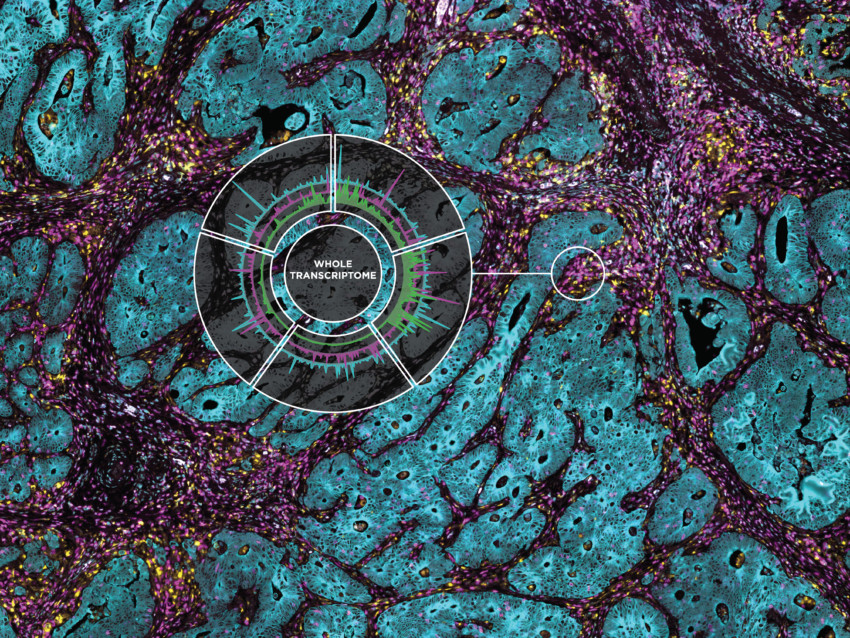
NanoString has partnered with Visiopharm® A/S, a leader in the digital pathology space, to automate image analysis and Region of Interest (ROI) selection for the GeoMx® Digital Spatial Profiler. GeoMx customers can leverage Oncotopix® Discovery AI-driven software to enhance tissue segmentation, speed up the ROI selection process, and standardize GeoMx results.

This integration of spatial multiomics with AI image analysis enables:
- Improved accuracy for biomarker discovery
- The ability to understand disease better
- Enhanced and more accurate predictive and prognostic biomarkers
- Improved success in drug discovery and development
- Generation of new therapeutic hypotheses
- Scale up to large-cohort spatial studies
Oncotopix Discovery for GeoMx DSP
Oncotopix Discovery for GeoMx DSP is a custom software offering from Visiopharm that can be used to:
- Enhance GeoMx tissue segmentation using AI
- Standardize GeoMx results with per-cell analyses
- Streamline GeoMx ROI selection with image overlay and automated ROI placement
Adding Oncotopix Discovery to the GeoMx workflow gives you access to:
Pre-trained Analysis Modules (APPS)
Leverage pre-trained analysis modules (APPs) to accelerate
image analysis workflow development. Visit the Visiopharm
APP Center to find templates to begin image analysis. Users can
get started with GeoMx-specific APPs or choose from among
120+ other Visiopharm APPs.
Train your own APP

Supercharge your spatial multiomics studies on GeoMx DSP with the power of automated tissue markup and ROI selection using Oncotopix Discovery:
- Use an H&E and/or immunofluorescence (IF) stained image to mark up the tissue and identify functional structures and cell types, making ROI selection simpler and faster.
- Overlay the marked-up image with the GeoMx image for rapid ROI transfer using the Tissuealign module.
- Set up rules for ROI selection that allow you to cut down on analysis time and automate your GeoMx studies.

of Queensland.
Oncotopix Discovery can enhance enrichment for GeoMx profiling to get a cleaner profiling signature from selected tissue compartments.
Exclusion of Unwanted Regions

Selection of cells by punctate staining

Contouring


How It Works
Integrate digital pathology into your GeoMx workflow by importing the GeoMx IF stained image files (OME.TIFF) into Oncotopix Discovery, processing the images using a Visiopharm APP of your choice to select ROIs and define AOIs, and then loading the exported OME.XML files back into the GeoMx Control Center for barcode collection and subsequent counting using the nCounter Analysis System or an Illumina sequencer. Downstream expression analysis is done in the DSP Data Analysis Center or open-source tools while further image analysis such as cell counting and tissue phenotyping can be done using Oncotopix Discovery.

Learn More
Request More Information
Contact our helpful experts and we’ll be in touch soon.

Related Resources


