
GeoMx DSP Knowledge Base: GeoMx DSP Data Analysis
This Knowledge Base serves as a technical resource specifically to answer common questions and assist with troubleshooting; NanoString University is the primary source for manuals, guides and other documentation for GeoMx systems and products.
For additional assistance, email support.spatial@bruker.com
Data Analysis
GeoMx DSP is paired with Data Analysis (DSPDA) software that allows users to easily visualize their data and simplifies data interpretation for both nCounter and NGS readout, covered in detail in our data analysis user manual here. Alternatively, users trained in R may extract their data and analyze it independently using open-source tools (Bioconductor). We also offer our Spatial Data Analysis Service (sDAS) for those who need further support. For more information on this, please check here.
Users can upload the RCC or DCC files to the GeoMx DSP instrument without the auxiliary server. Depending on the number of slides/AOIs, the data analysis steps may be executed slowly. Generally, nCounter readout panel data, CTA data, and WTA data from up to 4 slides can be analyzed on DSPDA without the need for an auxiliary server.
It is possible to do data analysis while doing data collection, however, this may overwhelm the software of the instrument and thus, it is recommended to wait for the run to complete and then perform data analysis.
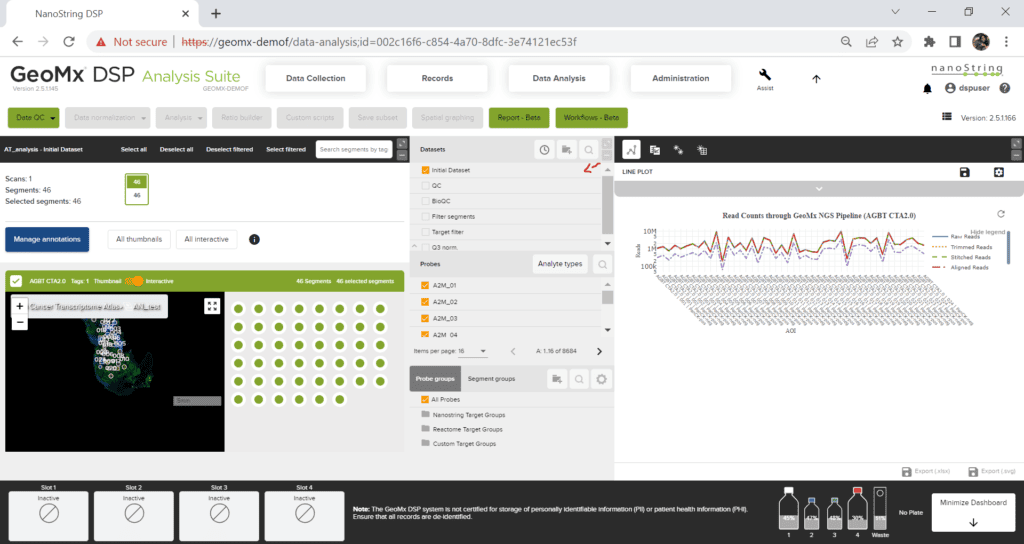
To download the initial dataset, open the DSPDA control center and in the Datasets window, hover over the right side of “initial dataset”. The save option pops up and the dataset can be saved as an Excel sheet.
You can find the X and Y coordinates in the initial dataset Excel file. For instructions to download it, please refer to the above FAQ. The X, Y coordinates are the center of your ROI as measured from the top left corner of the raw TIFF image. If your goal is to use the X, Y coordinates for plotting and if you are familiar with R, then we would recommend using the SpatialOmics overlay package available at GeoScripthub.
To download the GeoMx image, open the scan in the GeoMx DSP Scan Workspace. From the Export tab, select OME.TIFF and click export. This will export a multi-channel, pyramidal .TIFF images with ROI and Segment mask layers embedded in the header. For more information on this, please refer to our technote here.
- During scan setup, you may choose to select to include a No Template Control (NTC) well in the experiment, which receives no collection aspirate and therefore serves as a negative control during library prep/PCR amplification. The NTC may be used qualitatively, but it should not be used for data analysis correction. It is normal to see raw sequencing reads (in FASTQ files), or relatively small numbers of final probe counts of any NTC well(s) compared to true sample wells. Generally, ensure that there are significantly more counts in experimental sample collection wells than the NTC and then move on.
- In the case of a high NTC that matches or exceeds counts from experimental sample collection wells, for a given plate, data analysis can proceed if the samples pass biological QC. If biological QC fails, then look at the NTC counts more closely. NTC counts are a good indicator of library prep cleanliness which depends on factors such as molecular biology technique, operator experience, lab SOPs, etc. If the NTC counts are high or increasing over time, revisit these factors for best practices or cleaning.
- NTC counts may be used qualitatively to indicate potential contamination but should not be used quantitatively, e.g., as an alternative background noise threshold for specific probes or panels. This is because contamination is not likely to be consistent across all wells in a plate.
Normalization is a data transformation that balances the results between segments within an analysis using the counts from a specific set of probes.
For NGS readout, Q3 normalization is the recommended normalization for RNA assay and geomean of housekeepers or isotype controls is the recommended normalization method for protein assays. For more information, please refer to the white paper Introduction to CTA: Normalization.
For nCounter readout, housekeepers and isotype controls are commonly used to normalize RNA and protein data. For more information on normalization, please refer to the white paper: Introduction to GeoMx Normalization.
We do not recommend checking your GeoMx data on nSolver as nSolver is not designed to handle any of the GeoMx panel data. The best way to analyze GeoMx data is on DSPDA or through R independently.
Yes, you can analyze your GeoMx DSP data from nCounter readout in R. However, you cannot do this directly using the RCC files since this data must first be demultiplexed and calibrated for reagent lot. If you wish to analyze your nCounter readout with R, please upload your RCC files into the DSPDA suite, create a new study and then download the initial data set. For instructions on how to download the initial dataset, please check the FAQ: How can I download the initial dataset? The initial data set could then be used to run on R independently.
The following files are needed to run on GeomxTools for NGS readout:
- DCC files
- PKC files (can be accessed here)
- Annotation files derived from the lab worksheet
For the Spatial Multiomics (formerly known as Spatial Proteogenomics) assay, there is only one configuration file for the entire WTA+IPA run. The config file and resulting DCC file names show only the SeqCode label; however, it does contain data for both RNA and protein analytes provided that all necessary PKC files were associated with the scan at finalization. Once the DCC files are uploaded to the instrument and the initial dataset is generated, quality control and subsequent data analysis steps are performed for each analyte separately, and datasets are distinguished in the DataSets pane by an analyte icon.
GeoMx DSP researchers can submit their data to the GEO database. Here is the webpage with all the relevant information on this.
For NGS readout, files to be submitted to GEO for publication include:
- Raw data files (FASTQ)
- DCCs
- PKC
- Metadata.xlsx
For raw data, most customers submit the FASTQ files.
For nCounter readout, the data should be submitted as other data types: generic single channel submission, including the following files:
- RCC files
- PKC
- Metadata.xlsx
For metadata, you can download the latest template from GEO here.