
GeomxTools: An Open Source Package for Spatial Biology Data Analysis
Spatial biology is the new frontier of molecular biology that has revolutionized the study of gene and protein expression. Until recently, expression patterns were obtained via bulk sequencing or single-cell sequencing methods that obscured differences between individual cells and without any spatial context. Spatial biology, on the other hand, allows localization of gene expression in situ within cells of the intact tissue, thus maintaining the spatial organization.
NanoString’s GeoMx® Digital Spatial Profiler (DSP) is a powerful spatial and molecular profiling instrument that can simultaneously characterize regional and quantitative expression of 10’s-1,000’s RNA or protein analytes from a whole tissue slide image. This assay utilizes unique reagents (antibodies or RNA probes) coupled to UV photocleavable oligonucleotide barcodes. The user selects regions of interest (ROIs) to profile, and if required, each ROI segment can be further subdivided into areas of illumination (AOI) based on tissue morphology. The GeoMx DSP then photo-cleaves and collects expression barcodes for each AOI segment separately for downstream sequencing and data processing.
Genomic Data Analysis Tool Options
Given the complexity and high dimensionality of the dataset generated by GeoMx DSP, several genomics data analysis tool solutions are available that cater to different research applications. GeomxTools is one such solution built in the R statistical programming language for biostatisticians. It is available on Bioconductor, an open-source platform that provides tools developed for the analysis of high throughput genomic data: GeomxTools on Bioconductor.
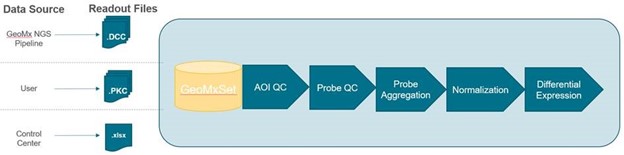
GeomxTools provides end-to-end analysis by taking raw DCC, PKC, and lab worksheet/annotation files and combining them to create a dataset for the GeoMx Whole Transcriptome Atlas (WTA) or GeoMx Cancer Transcriptome Atlas (CTA) (Figure 1). A great example of how analysis can be performed on real GeoMx data with the GeomxTools package can be seen here: RNA NGS Analysis Vignette.
This vignette takes one through an end-to-end GeoMx-NGS gene expression analysis workflow using a demo dataset created with the human WTA assay. This tool has been successfully used by many researchers to analyze GeoMx results, build automated GeoMx pipelines, and perform novel analyses and has been downloaded hundreds of times.
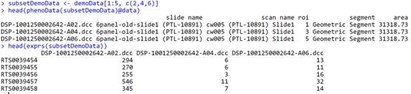
The GeomxTools package includes the GeoMxSet class, a data structure that contains the expression data, associated sample, and feature metadata expected from a GeoMx experiment. GeoMxSet objects come with built-in summarization and subsetting tools, such as bracket notation subsetting (Figure 2).
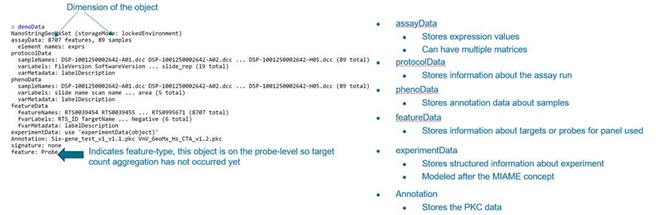
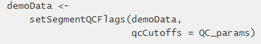
The GeoMxSet class, also includes slots for data unique to GeoMx, to indicate if the object’s expression data is probe or target level counts (Figure 3). Additionally, it includes unique GeoMx methods that allow for general GeoMx expression data analysis from QC to normalization. For example, it can analyze all AOI QC on a GeoMxSet object using just one function from the tool package (Figure 4).
We are continually developing new methods to support the unique readouts from NanoString spatial technologies and would love to hear about your experience with GeomxTools and any other NanoString open-source tools at support@nanostring.com.
For Research Use Only. Not for use in diagnostic procedures.

