Resolve Tumor Heterogeneity with Spatial Proteomics
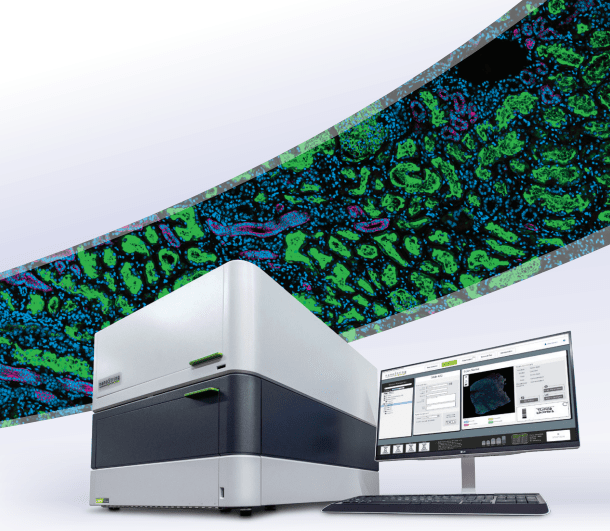
Profile up to 96 human or mouse proteins relevant to immuno-oncology research from distinct tissue compartments and cell type populations with the modular design of the GeoMx Immuno-Oncology Protein Panels. Take advantage of targeted content and expedited readout with the nCounter® Analysis System and easily scale up to large cohort studies for biomarker discovery and validation. With no specialized tissue mounting required and a workflow compatible with standard histology staining, you can easily add spatial proteomics to your lab’s capabilities.
The Immune Cell Profiling Core contains 18 targets for broad cell profiling and includes necessary controls for all GeoMx DSP experiments. Add up to 6 modules plus 5-10 custom targets to tailor content for your experiment. All cores and modules contain validated antibodies conjugated to unique oligonucleotide barcodes via a UV-photocleavable linker. After region of interest (ROI) selection and UV cleavage of the oligonucleotides, each barcode is recognized by a unique reporter probe that contains a fluorescent barcode. Reporter probes are imaged and counted by the nCounter® Analysis System to provide a direct, digital readout of protein expression that is mapped back to each corresponding ROI.

ROI were selected with mixed tumor and tumor microenvirontment (immune) segments in NSCLC FFPE tissue. ROI were segmented based on PanCK/CD45 morphology stain. Protein expression shows strong clustering by compartment.
Curated Content for Immuno-Oncology
Assay Validation
All GeoMx Protein Assays undergo extensive validation to ensure high quality GeoMx DSP data.
Each antibody is tested for specificity before and after oligonucleotide conjugation to ensure performance in the assay (Figure 1), and the performance of each module is validated so that it performs well alone versus along with other modules (Figure 2).

Figure 1: Example PD-L1 (DPROT_00004.1) is tested for specific staining pre- and post-conjugation to a specific indexing-oligonucleotide to ensure conjugation does not alter specificity.

Figure 2: Example signal for the Immune Cell Profiling Core is compared to the Immune Cell Profiling Core plus individual Modules to ensure no antibody-antibody interference in MOLT4 cell lines. Single antibody interference testing is also performed prior to combined core and module testing.

Related Resources


Case Studies
Case Studies
Request a Quote
Contact our helpful experts and we’ll be in touch soon.

