GeoMx® DSP Integrated with Sequencing Run Planning for NextSeq 1000/2000
Illumina and NanoString® collaborated further to pair the GeoMx® DSP with NGS readout from Illumina sequencing instruments. This partnership enables scalability and high throughput of whole transcriptomes and protein abundance from spatial samples.
In 2021, Illumina and NanoString launched a DRAGEN™-accelerated GeoMx NGS Pipeline that processes sequencing data from the GeoMx RNA or Protein assay into spatial expression count data. This secondary analysis pipeline is available on the cloud as DRAGEN on BaseSpace™ or on local premise as DRAGEN on NextSeq™ 1000/2000.
Today, we’re excited to announce that the sequencing run can now be kicked off directly from a GeoMx instrument for downstream NextSeq 1000/2000 sequencing. This end-to-end integrated workflow reduces touchpoints and automates secondary analysis (Figure 1).

Customers can access this new cloud-integrated workflow with an update to the newly release GeoMx DSP software version 2.5.1 and with an active BaseSpace Sequence Hub subscription. For those new to BaseSpace, customers can open a 30-day free trial account that includes promotional storage and iCredits to start (more information on BaseSpace product page). Alternatively, customers may choose the local integrated workflow, an option available if their instruments are not networked (DRAGEN on NextSeq 1000/2000).
Let’s take a walkthrough of the GeoMx and NextSeq 1000/2000 cloud-integrated workflow:
1 – Plan the sequencing run during the finalization of NGS Readout on GeoMx
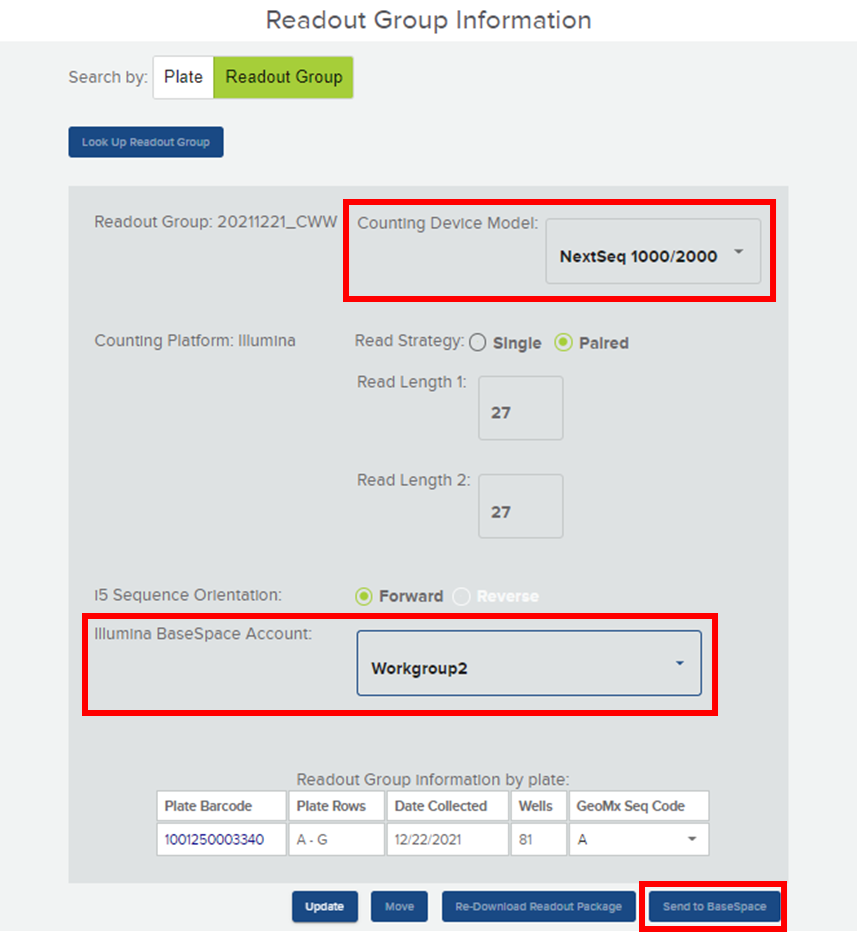
There is a one-time setup to connect the GeoMx DSP to your BaseSpace workgroup (see GeoMx DSP Online User Manual v2.5). During the finalization of the Readout Group at the GeoMx instrument, select “NextSeq 1000/2000” for the counting device model (Figure 2). Default parameters for the sequencing run will populate. For Illumina BaseSpace Account, select the appropriate linked workgroup from the dropdown menu. Pair your DSP collection plate with the NanoString GeoMx Seq Code plate letter (i.e. A – H) for downstream library preparation. Finally, click the “Send to BaseSpace” button. The NextSeq 1000/2000 Run Plan, Sample Sheet, and files for auto-launching the NanoString GeoMx NGS Pipeline on DRAGEN will be sent to BaseSpace.
2 – Start planned sequencing run on NextSeq 1000/2000
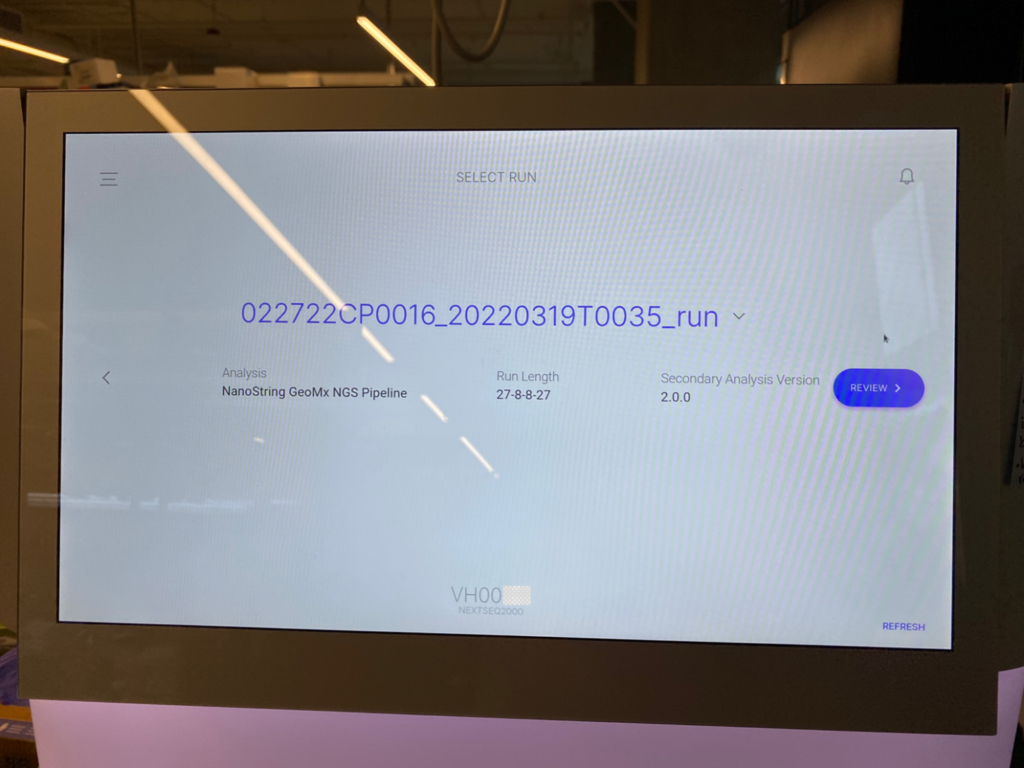
There is a one-time NextSeq 1000/2000 instrument settings selection of “Online Run SetUp” and “Proactive, Run Monitoring, and Storage.” At the NextSeq 1000/2000 instrument, log into BaseSpace and select the workgroup. A list of planned runs for the NextSeq 1000/2000 will appear. Select the appropriate planned run and then start sequencing (Figure 3).
3 – Retrieve processed spatial expression counts for data analysis with the GeoMx system
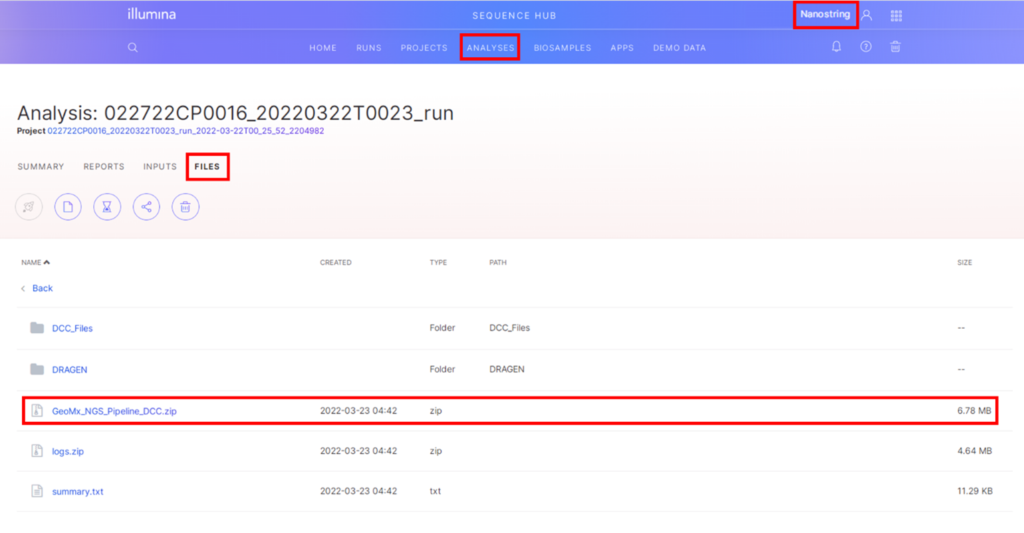
When the run is complete, log into BaseSpace and select the workgroup. Under the Analyses tab will be a list of analyses and click on the GeoMx NGS Pipeline analysis of interest (Figure 4).

In the analysis of interest, click on the Files tab and navigate to the GeoMx NGS Pipeline output folder. Click on the GeoMx_NGS_Pipeline_DCC.zip file to download (Figure 5).
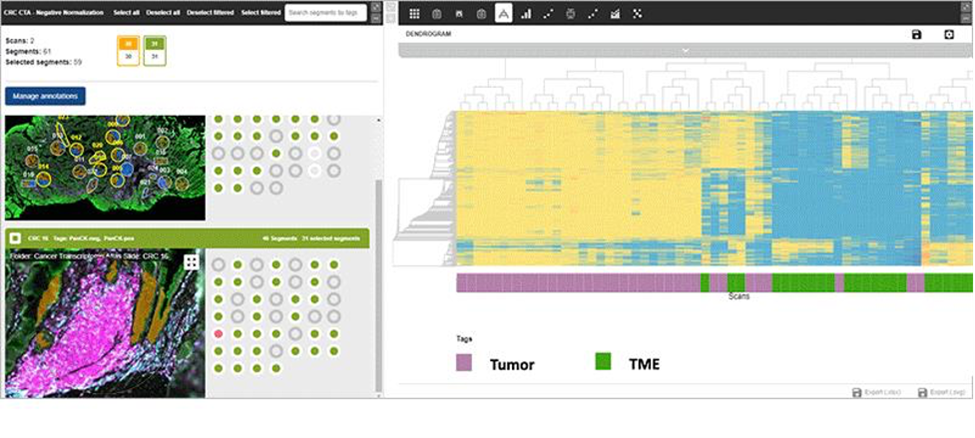
In the GeoMx data analysis software, directly upload the DCC.zip folder. The spatial count data will automatically pair to the appropriate GeoMx DSP experiment, coupling expression counts with the metadata and images. Customers can now visualize, interact, and analyze their spatially-resolved expression counts with the images (Figure 6).
Beyond simply enabling higher throughput by using NGS as a readout, teams from Illumina and NanoString have been working together to ensure the increasing volume of data is analyzed in a timely manner. We are committed to streamlining the workflow between our companies’ instruments to improve the customer experience. For assistance with the GeoMx assay or data analysis with the GeoMx NGS Pipeline BaseSpace App, contact support@nanostring.com. For answers to sequencing questions, contact techsupport@illumina.com.
To learn more about NanoString GeoMx Digital Spatial Profiler, please visit the NanoString website.
To learn more about NextSeq 1000/2000, please visit the Illumina website.
For Research Use Only. Not for use in diagnostic procedures.

