
Spotlight on Spatial Informatics: Overlay of Structurally Profiled ROIs on Tissue Images with SpatialOmicsOverlay R Package
Spatial biology is changing the way we view biology. Advancements in spatial biology are now enabling us to compartmentalize a tissue in terms of cells, tissue structure, or disease state. These compartments can be selected on a tissue image by a scientist or pathologist, but after the compartment selection step, the image is not typically reused.
At this point, data analysis and data visualization proceed how they would for a typical RNA-seq or scRNA-seq analysis workflow. However, this data and the story around it are amplified when presented in conjunction with the tissue image.
Data Visualization Challenges When Overlaying Tissue Images
At present, analysis packages lack the ability to handle the free-hand Region of Interest (ROI) selection capability made available by the GeoMx® DSP instrument software. Each ROI can be drawn in any shape imaginable and can be even further segmented to Areas of Illumination (AOI) within an ROI that follows the morphology of the tissue.
The immense range of possible sizes and shapes across an image presents a challenge when trying to overlay data on the image. To address this issue, we created the SpatialOmicsOverlay package. In this blog, we will demonstrate the package’s utility using the mouse brain data from the Spatial Organ Atlas, as seen in Figure 1.

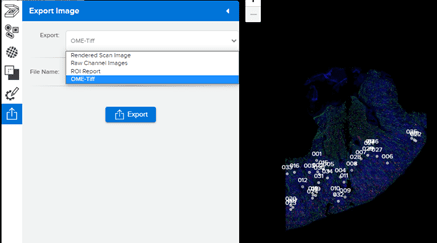
SpatialOmicsOverlay was written for the GeoMx® DSP and will also be compatible with CosMx™ SMI data in the future. The driving file is the OME-Tiff file that can be downloaded from the GeoMx DSP, as seen in Figure 2.
Spatial Informatics Made Simple
From this OME-Tiff, we extract the XML and image. The XML file contains all the spatial information necessary to position the ROIs in the correct location on the image. With the addition of ROI annotations, users can view compartments selected on the tissue image and colored by their annotations of interest. These annotations can be almost anything from tissue structure, disease state, gene expression profiling, or pathway score.
Users can easily manipulate their images and overlays by flipping axes, adding scalebars and fluorescence labels, cropping, and color correcting. All plots are ggplot based, which makes figure customization easy. Future releases are planned to include functionality that graph data on top of the image and perform image analysis.
SpatialOmicsOverlay can showcase biology that is easy to visualize, as seen in Figure 3. With this package, we can see not only gene counts, but also the exact cortical layers in which these genes are present (Figures 3B and 3C). For example, Etv1 has been shown to be specific to pyramidal neurons located in cortical layer V (Doyle et al. 2008), while Cux2 is specific to the upper layers II-IV (Nieto et al. 2004).
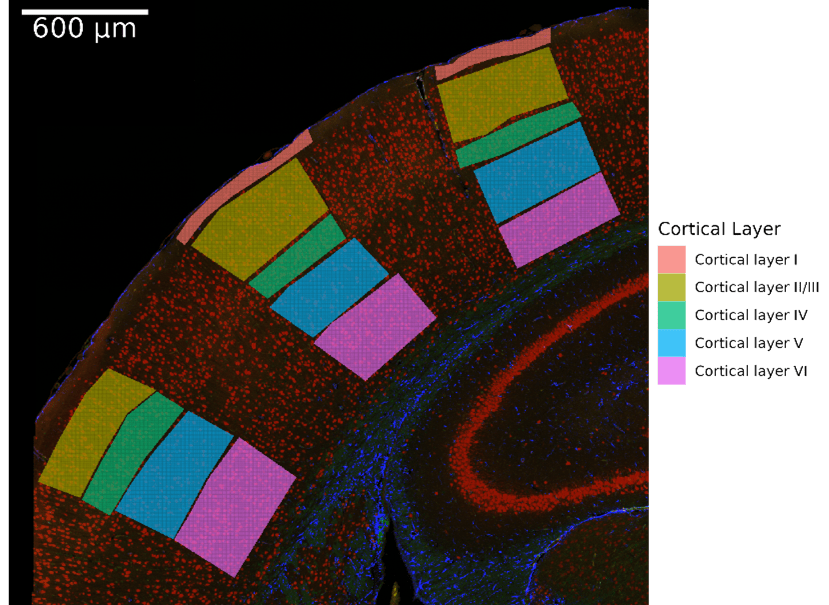
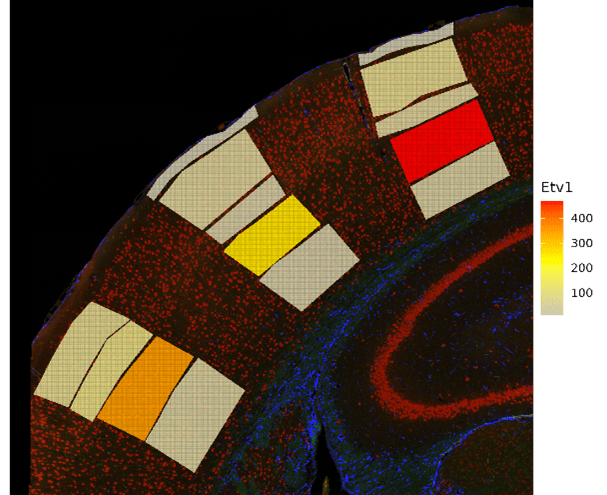
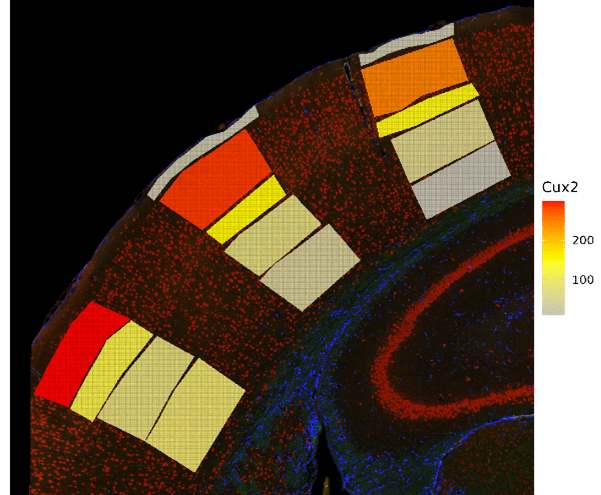
Figure 3. Mouse Brain Data Visualized. Cropped mouse brain slide focusing on the geometric cortical layer ROIs. A. Cortical layer for each ROI. B. Gene expression of Etv1 in the cortical layers. C. Gene expression of Cux2 in the cortical layers.
SpatialOmicsOverlay is an annotation and data visualization tool that can help create publication-ready figures. With its release, it helps fill a gap in current R packages for the burgeoning spatial biology field. Download the GeoScript Hub package and the introduction to SpatialOmicsOverlay vignette to use with your GeoMx DSP data today. This package will be submitted to Bioconductor for their fall 2022 release and was demoed live at BioConductor 2022 in Seattle.
For assistance with the GeoMx assay or data analysis with the SpatialOmicsOverlay package, contact support@nanostring.com. You can also learn more about NanoString’s GeoMx® Digital Spatial Profiler and start analyzing spatially resolved data.

