
Gene Expression Can Drive Your Research to New Heights
The word “gene” refers not only to the actual physical DNA that codes the gene itself, but also to all related downstream events, including gene expression, gene regulation, and gene mutation. In fact, rarely is the word gene used solely in reference to the DNA sequence, but usually also carries underlying implications about one or more of these more specific ideas. Most often, the word “gene” implies gene expression, and is used to discuss all or part of the process of using the instructions contained within the DNA of genes to produce RNAs and proteins.
Understanding gene expression and its associated processes is critical to understanding biology.
Every living organism has thousands of genes that code for RNAs and proteins. Since RNAs and proteins are responsible for a large portion of structures and functions in an organism, the production of those molecules is fundamental to the proper function of an organism’s cells. Therefore, understanding gene expression, and associated processes such as gene mutation and gene regulation, is critical to understanding biology. Genomic tools have been developed for this purpose, including NanoString’s nCounter® Pro Analysis System, discussed later in this article.
Why gene expression is important
Gene expression is summarized in the main dogma of biology: DNA codes for RNA which codes for protein. The initial product of gene expression, RNA, has a primary function of carrying the code of the DNA out of the nucleus, and its production, known as transcription, is often used synonymously with gene expression. Most RNAs are involved in protein production, known as translation, and fall into three types: messenger RNA (mRNA) carries the genetic “message” to the ribosomes for translation; ribosomal RNA (rRNA) located in the protein production machinery of the ribosomes; and transfer RNA (tRNA), which transfer amino acids to the growing protein (Rogers; Fujishima). Additional RNAs are not involved in protein production, but rather have functions such as RNA editing, gene regulation, and RNA interference. These small regulatory RNAs include small nuclear RNA (snRNA), microRNA (miRNA), and small interfering RNA (siRNA; Wang and Farhana). Production of any of these RNAs falls under the term gene expression.
Tools for analyzing both RNA and protein have advanced in recent years, providing researchers better options for detecting temporal and spatial properties of gene expression products.
Production of the protein translated from its associated RNA is also included under the term gene expression (Brody). The inclusion of both RNA transcription and protein translation under the term “gene expression” means these ideas are frequently used interchangeably during conversations about cellular function, and can sometimes cause confusion if the intended endpoint, either RNA or protein, is not clearly defined. However, some studies may examine both RNA and protein for comparative purposes, since the resulting protein may function in a different location from where it was produced (for example, secreted proteins such as cytokines). Studies of this nature often involve multiple molecular techniques since localizing RNA and proteins require separate methods of detection. Fortunately, tools for analyzing both RNA and protein have advanced in recent years, providing researchers better options for detecting temporal and spatial properties of gene expression products in cells and tissues. These tools are furthering our understanding of the cellular functions that underlie the biological processes of biological systems.
History of gene expression detection
Detection of gene expression at the RNA level dates back to the development of in situ hybridization (ISH; Gall). Using labeled DNA or RNA probes complementary to the transcript of interest, ISH identified the areas of a tissue expressing the genes, providing visual clues for determining which cells expressed the gene. Subsequent development of the Northern blot in 1977 (Alwine) was another breakthrough that gave biologists the ability to examine gene expression in any tissue. While incalculably valuable to expanding the knowledge base for gene expression, the original protocols for these and other RNA-detecting techniques were time consuming and limited to one probe per assay. These techniques often created as many questions as they answered, highlighting the need for a broader approach to gene expression studies.
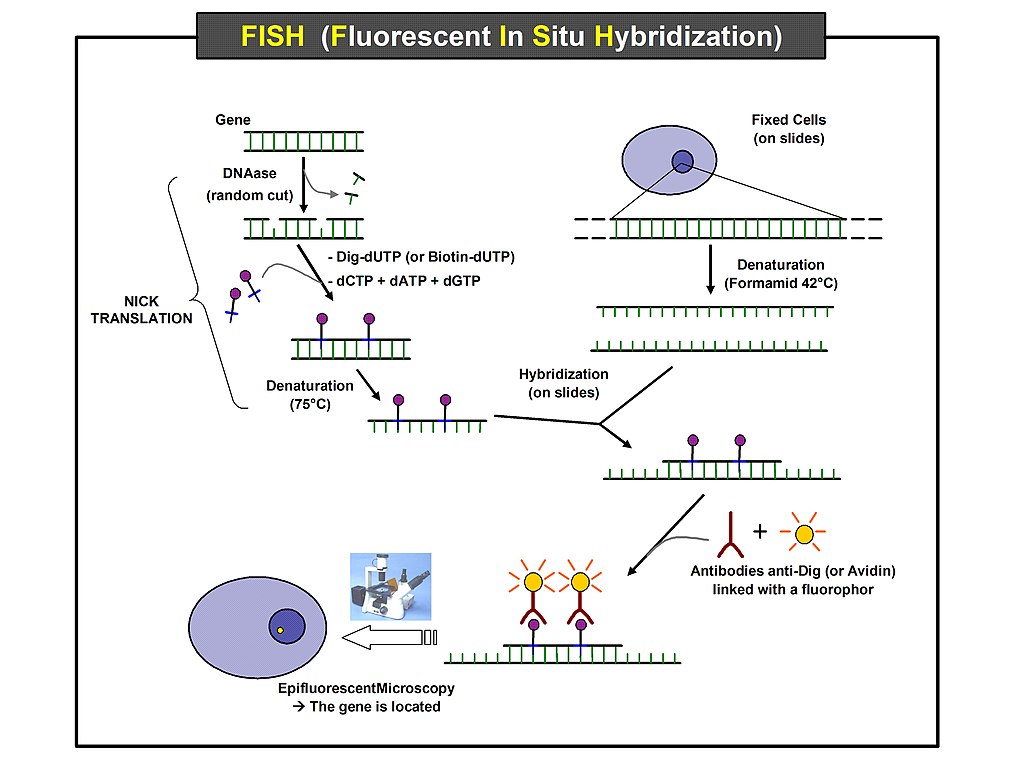
Fluorescence ISH, or FISH, improved gene expression analysis by providing the capability of labeling separate probes with different colors of fluorescent tags, enabling the visualization of multiple transcripts at once. Used in both bulk tissue analysis and on histological slides of intact tissue (Shakoori), FISH, while still time consuming, uncovered more information from less biological material by using multiple probes on a tissue slide. When used at once, multiple probes could now determine if the target transcripts were expressed at the same time in the same tissue regions, known as colocalization. Additionally, since FISH probes are DNA oligonucleotides, the same slide can be hybridized serially with multiple probes for gene expression analysis of many genes (Wilcox). In this way, FISH has been instrumental in building the initial framework for gene expression profiling in tissues.
Understanding biological processes means untangling the complexities of gene expression both spatially and temporally, which requires the ability to study more than a handful of genes at a time.
However, the completion of genome projects has provided exponential amounts of available gene sequence information which require faster and broader methods, ideally with capabilities for screening all genes expressed in a tissue. Furthermore, techniques such as FISH have elucidated the differential expression of genes among various cell types in a tissue. These factors indicated that understanding biological processes means untangling the complexities of gene expression both spatially and temporally, which requires the ability to study more than a handful of genes at a time. To this end, techniques for analyzing gene expression patterns, or profiles, were developed.
The advent of gene expression profiles and their effect on research
The confluence of genome projects and accelerated computing capabilities made it possible to analyze large swaths of DNA sequence data in a relatively short time. Accelerated computing capacity also lent itself to analysis of molecular detection methods, particularly for visualization of fluorescent probes (Teves). Initial technologies used visualization equipment connected to computers programmed to recognize and count specific fluorescent signals in tissue microarrays (Hrdlickova), giving researchers an automated method of counting labeled molecules. Subsequent automated technologies, including NanoString’s nCounter (Geiss), increased the capacity for labeling and quantification, as well as the degree of automation. Today, entire transcriptomes can be screened and quantified on a single slide (He).
The entire embryonic developmental process relies heavily on the appropriate timing and spatial context of specific gene expression profiles.
A given tissue expresses only a subset of the organism’s genes at any one time, while individual cells express an even smaller subset. Indeed, correct spatial and temporal regulation of gene expression is essential for precise modulation of cellular behaviors (Nomoto 2019). The field of developmental biology is a great model for studying differential gene expression among neighboring tissues and cells (Choe). After fertilization, the identical cells of the early embryo eventually undergo cellular differentiation based on timing and spatial context of gene expression gradient signals that initiate subsequent expression of downstream genes, forming the anatomical blueprint for further organismal development. As the cells multiply, dynamic gene expression patterns direct continued cellular differentiation and growth. The entire developmental process, from tissue delineation to organ development and morphology changes, relies heavily on the appropriate timing and spatial context of specific gene expression profiles (Choe). The gene expression profiles needed to successfully build a functioning organism are exceedingly complex, especially given the dynamic and ever-changing cellular environment created by the various cell and tissue interactions necessary for proper organismal development.
Unraveling this complex web of gene expression profiles presents a cumbersome and extremely time-consuming analytical challenge for researchers when done a few genes at a time. Further complicating our understanding of such biological processes is that genes expressed together for appropriate cell function sometimes work in concert, sometimes in sequence, and sometimes antagonistically. The ability to disentangle these spatial and temporal patterns of gene expression is therefore critical to understanding the roles specific genes play in tissues and cells.
Since gene expression patterns are dynamic and subject to various stimuli, reliable and efficient methods are needed for understanding cell and tissue functions. For proper cell function, genes must be expressed in a highly regulated manner; therefore, understanding complex gene expression profiles in healthy tissue is essential. Knowledge of gene expression profiles in healthy tissue then serves as a baseline for studying changes in those genes during disease processes. Uncovering relevant gene expression profiles is therefore highly valuable for both basic and clinical research.
Uncovering relevant gene expression profiles is highly valuable for both basic and clinical research.
An example of how basic research benefits from gene expression profiles (GEP) is a study in which a GEP was developed from analysis of the expression patterns observed in macaque monkeys in response to Ebola virus infection (Speranza). A total of 769 genes involved in immunology and inflammatory processes were studied pre- and post- Ebola infection in host monkeys. A strong induction of innate immune system genes was observed in circulation at early times post-exposure, with later time points showing more neutrophil-associated genes (Speranza). In this way, GEPs improve our understanding of the disease process and provide leads for potential treatment intervention points.
In the clinical setting, GEPs are used to predict patient response to immunotherapy cancer treatments. Normal gene expression is dysregulated during tumorigenesis, producing GEPs in tumors that differ from not only surrounding benign tissue, but also from other tumors of the same type. Therefore, tumors sharing a tissue of origin but from different patients are likely to have a different mix of active genes in their GEPs, causing changes in cell function. An example of this is immune cell infiltration in tumors. Seen as non-self, tumors initially raise an immune response in the patient that is often then suppressed when the tumor activates immune inhibitory factors. These inhibitory factors can prevent the immune cells from infiltrating the malignant tissue or from recognizing the tumor as non-self, thus evading immune response.
Comparison studies of gene expression patterns in tumors and normal tissue have identified GEPs involved in the tumor’s development and progression. As a result, immune checkpoint inhibitors (ICI) have been identified as an intervention point for priming the patient’s immune system to attack the tumor (Ayers). Specifically, blocking the ICI pathway defined by the receptor/ligand pair PD-1/PD-L1 has been shown to precisely and effectively knock out tumors by reversing tumor-inhibition, allowing immune cells to infiltrate and attack the tumor. Novel immunotherapies such as anti-PD-1/PD-L1 precisely attack cancer cells while avoiding neighboring non-cancer cells, thus limited unwanted side effects seen with other cancer treatments (Ayers).
Discovery of additional gene expression profiles will continue to expand physicians’ toolbox for choosing appropriate cancer therapies.
Unfortunately, not all patients respond equally to anti-PD-1/PD-L1 immunotherapy, with some patients showing little to no response (Ayers). Transcriptomic analysis of a wide range of cancer patients led to the discovery that a specific interferon (IFN)-g-related GEP predicts response to anti-PD-1/PD-L1 treatment. Identification of the IFN- g GEP has given physicians a powerful tool for deciding, prior to prescribing treatments, on whether the patient will respond to ICI treatment. Discovery of additional GEPs will continue to expand physicians’ toolbox for choosing appropriate cancer therapies and further support the use of GEPs as valuable biomarkers for assessing the role of gene expression in biological systems and disease processes (Speranza; Ayers; Haddad).
nCounter Pro Provides Gene Expression Profile Analysis
For gene expression studies, particularly those involving GEPs, efficient and reliable detection of RNA is the key for successful transcriptomic analysis. While the biochemistry of nucleotide pairing makes it simple to develop highly specific, reliable probes, working with RNA can be tricky. One challenge is maintaining sample integrity due to the ubiquity of RNA-degrading enzymes, known as RNAses. Although decades of RNA research have led to tried-and-true techniques for preserving RNA in a sample, instances of RNA degradation still occur in samples that have been archived or were not well preserved. In these cases, degraded sample RNA may be missing the recognition sequences required for the enzymatic amplification and elongation steps employed by many RNA analysis techniques, thereby providing less-than-optimal data.
Efficient and reliable detection of RNA is the key for successful transcriptomic analysis, but maintaining sample integrity and detecting low copy number transcripts can be tricky.
An additional challenge for many techniques is accurate quantification of low copy number RNAs. Detecting low copy number transcripts typically requires either relatively large tissue samples, which are often difficult to obtain, or amplification steps that can introduce bias via unintended preferential primer binding (Chepelev). Overcoming these issues is necessary to produce gene expression profiling results that are reliable and reproducible, especially in a clinical setting. If the technique can also be rapid and use smaller samples, even better.

NanoString has developed a gene expression analysis technology for its nCounter Pro Analysis System that does not require enzymes or amplification. Instead, it uses molecular barcode-labeled probes that directly hybridize to the target RNA for direct detection and quantification. The simple nCounter protocol requires minimal hands-on time (approximately 15 minutes) to set up the probe hybridization reactions. Once the reagents are assembled, the automated system takes over to quantify and analyze gene expression in the samples, introducing less variability and ensuring highly robust, reliable data across clinically-relevant samples. nCounter Pro’s molecular barcode technology provides direct counting of molecules, accomplished by using a unique target-probe complex in which the target RNA is directly tagged with both capture and reporting probes. Direct counting of these RNA-probe complexes, immobilized and aligned on an imaging surface, allows for simplified analysis after scanning by an automated fluorescence microscope. Collected data of directly counted barcodes is then analyzed by intuitive analysis software connected to the instrument.
nCounter uses molecular barcode-labeled probes that directly hybridize to the target RNA for direct detection and quantification. The protocol requires minimal hands-on time.
Gene expression analysis involving any type of RNA can be performed with molecular barcoding technology, since direct hybridization can easily identify small RNAs that may be difficult to amplify in a highly reproducible manner. While off-the-shelf probe panels are available for mRNA, custom panels can be synthesized for any RNA type needed – rRNA, tRNA, snRNA, miRNA, and siRNA – for performing single-tube multiplexing of up to 800 RNA targets. Analysis of the resulting data is simple and quick via associated analysis tools, providing publication-ready figures in a matter of hours.
In addition, nCounter’s non-enzymatic hybridization protocol can be performed on crude RNA samples prepared from a variety of inputs (fresh frozen tissue, serum, plasma, PBMC and FFPE) in the absence of library preparation, reducing sample preparation time. Faster than NGS and simpler than qPCR, nCounter’s molecular barcode technology, optimization for FFPE samples and quick turnaround time make it ideal for clinical-sample GEP analysis (Speranza).
The use of gene expression profiling as biomarkers has spawned the development of multiple off-the-shelf probe panels from NanoString. Able to screen over 800 genes at a time, NanoString’s probe panels are useful for preclinical and clinical research in oncology, immunology, and neuroscience for such things as biomarker discovery and signature development, studying drug mechanism of action, efficacy, treatment response, and optimizing gene/adoptive cell therapy development. Many nCounter panels also include the immune cell profiling feature, a series of gene signatures for 14 different immune cell types useful for quantifying the relative amounts of each immune cell type by assigning signature scores for each sample.
Gene expression profiles and gene signatures are the cutting edge of gene expression technology, and will continue to drive preclinical and clinical research.
References
Alwine JC, Kemp DJ, Stark GR. Method for detection of specific RNAs in agarose gels by transfer to diazobenzyloxymethyl-paper and hybridization with DNA probes. Proc Natl Acad Sci U S A. 1977 Dec;74(12):5350-4. doi: 10.1073/pnas.74.12.5350. PMID: 414220; PMCID: PMC431715.
Brody L (2023) Gene Expression, NIH National Human Genome Research Institute
Chepelev I, Wei G, Tang Q, Zhao K. Detection of single nucleotide variations in expressed exons of the human genome using RNA-Seq. Nucleic Acids Res. 2009 Sep;37(16):e106. doi: 10.1093/nar/gkp507. Epub 2009 Jun 15. PMID: 19528076; PMCID: PMC2760790.
Choe K, Pak U, Pang Y, Hao W, Yang X. Advances and Challenges in Spatial Transcriptomics for Developmental Biology. Biomolecules. 2023 Jan 12;13(1):156. doi: 10.3390/biom13010156. PMID: 36671541; PMCID: PMC9855858.
Fujishima K, Kanai A (2014) tRNA gene diversity in the three domains of life. Front Genet 5:1–11
Gall JG, Pardue ML. Formation and detection of RNA-DNA hybrid molecules in cytological preparations. Proc Natl Acad Sci U S A. 1969 Jun;63(2):378-83. doi: 10.1073/pnas.63.2.378. PMID: 4895535; PMCID: PMC223575.
Geiss GK, Bumgarner RE, Birditt B, Dahl T, Dowidar N, Dunaway DL, Fell HP, Ferree S, George RD, Grogan T, James JJ, Maysuria M, Mitton JD, Oliveri P, Osborn JL, Peng T, Ratcliffe AL, Webster PJ, Davidson EH, Hood L, Dimitrov K. Direct multiplexed measurement of gene expression with color-coded probe pairs. Nat Biotechnol. 2008 Mar;26(3):317-25. doi: 10.1038/nbt1385. Epub 2008 Feb 17. PMID: 18278033.
He et al, 2021 High-Plex Multiomic Analysis in FFPE Tissue at Single-Cellular and Subcellular Resolution by Spatial Molecular Imaging
Hrdlickova, R.; Toloue, M.; Tian, B. RNA-Seq methods for transcriptome analysis. Wiley Interdiscip. Rev. RNA 2017, 8, e1364.
Rogers, S.O. Integrated evolution of ribosomal RNAs, introns, and intron nurseries. Genetica 147, 103–119 (2019). https://doi.org/10.1007/s10709-018-0050-y
Shakoori AR. Fluorescence In Situ Hybridization (FISH) and Its Applications. Chromosome Structure and Aberrations. 2017;343-367. Published 2017 Feb 10. doi:10.1007/978-81-322-3673-3_16
Teves JM, Won KJ. Mapping Cellular Coordinates through Advances in Spatial Transcriptomics Technology. Mol Cells. 2020 Jul 31;43(7):591-599. doi: 10.14348/molcells.2020.0020. PMID: 32507771; PMCID: PMC7398793.
Wang D, Farhana A. Biochemistry, RNA Structure. [Updated 2022 May 8]. In: StatPearls [Internet]. Treasure Island (FL): StatPearls Publishing; 2022 Jan-.
Wilcox JN. Fundamental principles of in situ hybridization. J Histochem Cytochem. 1993 Dec;41(12):1725-33. doi: 10.1177/41.12.8245419. PMID: 8245419.