How Cell Counters and Cell Type Profiling Can Help Analyze Gene Expression Profiles
Cell counters, also known as cell sorters, are instruments that separate and count specific cells of interest using characteristic properties of those cells. The original cell counters, known as Coulter counters (Silveira), used mostly for counting types of blood cells, separated cells by aligning them using flow techniques for sorting according to morphology, size, or electrical impedance properties (Silveira).
Today, cell counters are routinely used in basic research, clinical practice, and clinical trials for determining cell characteristics and function, detecting microorganisms, biomarker detection, and diagnosis of health disorders such as blood cancers. Cell counters are therefore a key instrument in advancing cellular and molecular research.
Types of cell counters
A typical cell counter consists of three main component systems: fluidics, optics, and electronics (Silveira). The fluidics system carefully controls the flow of cell samples through the machine in a manner that isolates individual cells as they go through the optics system. The optics components, depending on the type of cell counter, usually consist of electrodes or a laser, a detection or interrogation point and an electrostatic field sensor or photomultipliers. The electronics system, typically an oscilloscope or computer, is connected to the electrostatic field sensor or photomultipliers to count and record the number of cells identified. The specificity of cell counters is very high, especially when using cell surface markers. But the throughput capabilities are limited, prompting researchers to enrich their cell samples for the cells of interest.
Advanced cell counter instruments can now employ lasers to identify cells in a process known as multiparametric flow cytometry.
While the original Coulter counter relied on electrical impedance caused by different electrical resistance properties of cells, the introduction of lasers and fluorescent labels made possible the use of fluorochrome excitation as a manipulable method for specific cell identification. Advanced cell counter instruments can now employ lasers to identify cells by excitation of known fluorescent probes at different wavelengths of light in a process known as multiparametric flow cytometry (MFC; Bene).
Just the FACS
A subset of these instruments, known as fluorescence-activated cell sorters (FACS), have become an integral tool for identifying and characterizing cells with properties relevant to researchers’ interests. For cell identification based on cell-specific proteins, fluorescently-labeled monoclonal antibodies are used for sorting and counting cells by FACS (Bene). External and internal proteins can be labeled with monoclonal antibodies. Additionally, RNA transcript populations in cells can be studied with FACS by using fluorescently-labeled oligonucleotide probes. FACS thus allows researchers to study any biological molecule in a cell for multiomic analysis.
A drawback of cell counters such as MFC and FACS, as efficient at identifying and counting specific cell types as they are, is their lack of morphological analysis.
Imaging flow cytometry
The development of imaging flow cytometry in recent years has provided a different approach for performing the analysis of morphological characteristics and the characterization of single cell phenotypes derived from a large heterogeneous population (IFC; Han). Incorporating a polychromatic approach to flow cytometry, recently developed IFC instruments can simultaneously measure 19 parameters in a high-speed manner (Han). Coupling high-throughput capacity with multiparametric analysis for detecting single cell properties very quickly (rates can be as high as 100,000 cells per second), IFC has become an irreplaceable tool for studying specific subpopulations within high-volume cell populations (Han). IFC combines the high-throughput single-cell identification capabilities of flow cytometry with the cell image acquisition of microscopy in an integrated system for examining specific cell morphology.
Unfortunately, the dissociation of cells prior to IFC analysis destroys any information about spatial context.
However, the dissociation of cells prior to IFC analysis destroys any information about spatial context, forcing users to make decisions in the absence of any information contained in cell images. It is therefore necessary to accommodate IFC with conventional static fluorescent microscopy studies. Newer technologies overcome the need to decide between high-throughput and spatial context for analyzing the multiomics of single cells.
Cell cultures and in vivo studies
In cellular and molecular biology research, cells in culture are one of the most used resources, especially in initial experiments of a biological system. Both primary cell cultures and cell lines are typically used for obtaining data in studies, so the ability to sort cells based on differential treatment responses can be key to understanding the mechanisms of cell function. Cell counters do a great job sorting populations of cells when stained for specific properties such as genomic expression analysis but lose the spatial context of the cellular neighborhood. Cell culture experiments therefore tend to use a variety of endpoints for analysis, including staining of fixed cells in vitro for visualization, lysing of cells for quantitation of gene expression, or staining the cells for cell counting and morphology for comparison for spatial context analysis preserved in slides of tissue samples.
In addition to cell culture studies, in vivo studies often include experiments involving the dissociation of tissues for examination of individual cells by cell counters. This technique is valuable for looking at changes in gene expression in a tissue (ref). However, even though the results from tissue dissociation experiments give a truer picture of in vivo conditions, any information regarding the spatial context of the cells is again lost upon dissociation. The complexity of tissue environments demands the ability to look at the results of in vivo experimental manipulations in its natural spatial context for maximal insight into cellular function.
nCounter’s Cell Type Profiling Capabilities
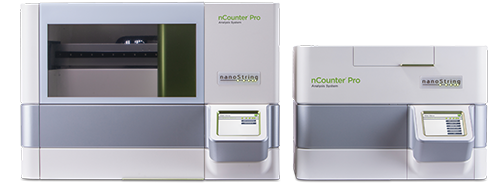
NanoString developed a high-throughput, simple to use instrument, the nCounter® Pro Analysis System, that produces robust, reproducible results for studying gene expression in tissues. Coupled with NanoString’s GeoMx® DSP and/or CosMx™ SMI, nCounter Pro can provide bulk gene expression profiling data for guiding the genomic studies in a spatial context on the other platforms. Using a variety of sample inputs – lysates of cells from culture or tissues, fresh frozen tissue, FFPE tissue samples, among others — the nCounter Pro is not a cell counter, per se, but offers cell-type profiling analysis capabilities that measure the relative abundance of select immune cell types.
nCounter’s method for quantifying individual cell types begins by correlating the expression of marker genes with the abundance of a single cell population to define gene expression signatures. To date, 14 different immune cell types have been identified by their gene signatures for inclusion in gene expression profiling panels spanning oncology, immunology, and immuno-oncology. Additionally, gene expression signatures have been defined for distinct cell types encountered in the field of neuroscience, including neurons, astrocytes, microglia, oligodendrocytes, and endothelial cells (Danaher).
These signatures are used in conjunction with the nSolver™ Advanced Analysis Software to quantify the relative abundance of specific cell types. In brief, this method of quantifying relative cell type abundance starts with these previously identified cell type-associated gene signatures. With a large enough dataset, highly correlated genes coming from one cell-type should “track together.” The expression levels from the various genes in the signature can then be utilized to produce a numerical score that varies proportionally to the abundance of that cell type. While this method does not give a direct count of cell number, it does track relative abundance. The expression levels of cell-type-specific mRNAs are used to generate cell-type profiling scores for immune cell types. Dependent on probe-specific counting and capturing efficiencies, these scores do not give a direct count of the cells in a sample but act only as a relative cell abundance value when compared to the same cell type in other samples or groups of samples (Danaher).
Although nCounter Pro cannot be used to measure the abundance of a cell type relative to other cell types in the sample, nor the quantity of cells within a single sample, the nCounter workflow features minimal hands-on time and automated throughput and analysis. The nCounter technology requires no amplification or enzymatic steps, making it more reproducible and reliable than other RNA labeling transcriptomic techniques.
References
Béné MC, Lacombe F, Porwit A. Unsupervised flow cytometry analysis in hematological malignancies: A new paradigm. Int J Lab Hematol. 2021 Jul;43 Suppl 1:54-64. doi: 10.1111/ijlh.13548. PMID: 34288436.
Danaher P and Xu w https://event.on24.com/wcc/r/2189252/5C83EEFFE2E66EAC183018EDAC9A17D9?partnerref=WEB
Han Y, Gu Y, Zhang AC, Lo YH. Review: imaging technologies for flow cytometry. Lab Chip. 2016 Nov 29;16(24):4639-4647. doi: 10.1039/c6lc01063f. PMID: 27830849; PMCID: PMC5311077.
Kachel V, Benker G, Lichtnau K, Valet G, Glossner E. Fast imaging in flow: a means of combining flow-cytometry and image analysis. J Histochem Cytochem. 1979 Jan;27(1):335-41. doi: 10.1177/27.1.374598. PMID: 374598.
Silveira GF, J Evolution of Flow Cytometry Technology Microb Biochem Technol 2015, 7(4):213-6 DOI: 10.4172/1948-5948.1000208