
Welcome to the nSolver™ Software Tech Blog!
We love that you’re here. Here’s why you’re going to love it, too:
- Fun-size articles on nSolver & Advanced Analysis. In between scientific papers, grant applications, and your other lengthy reading obligations, our blog post will be a fresh change of pace. Each one will be short and to-the-point, a little on the lighter side, and with a practical focus that you can apply to your data analysis workflow immediately. For a taste, see below!
- It’s your data! Prepping samples, running experiments, and expertly sipping coffee while you wait for your data are only half of the battle; you still need to figure out what all those data points mean. Here, we will not only show you how to get the most out of your analysis but we will also keep you up-to-date on the latest ways to gain deep biological insight quickly and easily from complex samples.
- Cutting edge tech topics. We’re not only the authority on all things NanoString- we are a community of top-notch scientists, biostatisticians, and engineers who work with a shared passion to bring the best research and clinical tools to you. Expect poignant, timely, and interesting posts written by our stellar staff. Today, for example, we have a short article on creating pairwise ratios in nSolver.
- Stay up to date. Follow this tech-focused blog to stay on top of the latest nSolver software releases and exciting new collaborations as well as new trends in data visualization, multi-omic analyses and biostatistics. We aim to keep you informed and entertained (because who doesn’t like to sound like the data analysis expert at lab meeting?
As we grow this blog, we’d like to hear from you – what would you like to see in this blog? What wisdom would you like to see imparted from your friendly NanoString scientists in blog-like fashion? What topic or technique would you like to see hashed out? Send us an email (softwaresuggestions@nanostring.com) and let us know. We’re all ears, heart, and mind, here – say on!
Erica Pawlak, one of our awesome Field Applications Scientists, wants you to know how to set up pairwise ratios in nSolver.
It is common, particularly in clinical and translational research, to design experiments that allow each experimental measurement to be compared back to its own, matched, control. Examples of this would include: comparing tumor samples to healthy tissue samples (from the same individual), or comparing samples taken before treatment to samples taken after treatment. Letting each individual serve as its own control reduces the impact of variance between individuals across your experiment population.
Statistically, the appropriate test for this experimental design is the Paired T-test. This version of the t-test will determine if the mean difference between the paired measurements is significantly different from the null hypothesis, or zero. While basic nSolver does not make paired comparisons, it is possible to set up this comparison using the Advanced Analysis module. By creating two variables for each sample, one identifying the individual, and the other identifying a second variable (such as treatment), we are able to set Advanced Analysis up to subtract any individual-to-individual variation from the overall change in expression.
 For example: Let’s say you have multiple patient samples (A,B,C…F) and they have all undergone the same treatment. You’ve tested them pre-treatment and then again post-treatment and you’d like to do a paired comparison for each sample between their pre- and post-treatment results.
Here’s how to set this analysis up in nSolver:
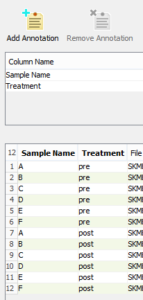
- In the Sample Annotation step of creating an experiment, click Create Annotation twice, creating two columns.
- Define one column Sample Name and the other, Treatment.
- Fill the annotations in each column for the samples, A-F for Sample Name and pre or post for Treatment.
- In the Build Ratios step, select Partitioning by and choose Treatment and pre from the drop-down boxes.
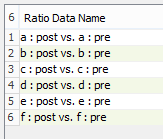
Voilà! nSolver will generate all pairwise ratios for each sample pair.
FOR RESEARCH USE ONLY. Not for use in diagnostic procedures.

