Digital Spatial Profiling
Understanding how gene expression orchestrates cellular organization within tissues is essential to gain mechanistic insights into development and disease.
Spatial transcriptomics allows capturing of transcriptional activity along with positional context within a region or single cells of intact tissue, such as FFPE-preserved human tissue. Similarly, spatial proteomics allows the spatiotemporal detection of protein expression in intact tissue. Several spatial technologies that combine both transcriptomics and proteomics available today allow researchers to locate transcripts or proteins, often down to the subcellular level, providing an unbiased map of gene expression and enabling numerous discoveries in several fields including developmental biology, oncology, and infectious disease. Digital spatial profiling is one of the several multiomics platforms developed over the past few years.
Approaches to spatial transcriptomics
The molecular biology approaches of Next Generation Sequencing (NGS) and RNA-sequencing (scRNA-seq) have led to the birth of spatial biology. NGS technology has enabled multiplexed analysis of DNA on a massively parallel scale of tens of thousands of sequences from individual single strands of DNA analyzed separately, yet simultaneously. While scRNA-seq has provided transcriptional profiling of individual cells, the spatial location is not conserved in this technique.
Spatial transcriptomics approaches can be broadly categorized into sequencing-based and imaging-based methods.
Today, several spatial transcriptomics platforms have emerged that employ different combinations of microscopy, RNA sequencing, immunofluorescence, and in situ hybridization. The technical parameters such as the number of genes counted (plex), the breath of the tissue profiled (coverage), size of the unit profiled (resolution), and throughput (number of samples and speed of profiling) vary among the different techniques. In general, spatial transcriptomics methods can be broadly categorized into 1) Sequencing-based methods where the location of mRNA transcripts can be recorded before they are extracted and undergo NGS library preparation and sequencing, and 2) Imaging-based methods that directly image the mRNA transcripts in situ.
Sequencing-based approaches capture transcripts in an unbiased manner and are capable of whole transcriptome coverage. Here, the mRNA is extracted from the tissue while preserving spatial information and subsequently profiled via NGS techniques The spatial information is preserved either via direct capture and recording of location with imaging or by using spatiallybarcoded probes with a sequence indicating location before NGS.
Imaging-based approaches contain both the spatial information and the identity of the transcripts in the acquired images of the tissue samples. This is achieved either by in situ hybridization that uses fluorescent-labeled mRNA probes or by in situ sequencing that displays in situ sequencing signals on tissue. With the in situ hybridization technique, the mRNA can be imaged repeatedly with the same probes but with different fluorophores to create a gene-specific barcode. Then, the mRNA transcripts are directly sequenced within a tissue block or section.
Both these approaches provide a location for each individual transcript detected at the level of a single-molecule and expression profiles at the level of subcellular or cellular resolution which is subsequently collected as image data.
Digital spatial profiling: a sequencing-based approach
Digital spatial profiling (DSP) is a highly multiplex spatial profiling method for proteins or RNAs suitable for use with fresh frozen or FFPE samples. DSP technology relies on three basic premises:
- oligonucleotide tags: specialized probes capable of providing a multiplexed readout of proteins or RNAs
- affinity reagents: either antibody or RNA probes to which the oligonucleotide tags are attached through a photocleavable linker
- photocleaving light: projected onto the tissue sample to release oligonucleotides in a given region of interest (ROI).
The data generated by DSP platforms are not direct images, but spatially registered counts of the hybridized probes.
The GeoMx® Digital Spatial Profiler combines standard immunofluorescence techniques with digital optical barcoding technology to generate high throughput gene or protein expression data digitally from intact tissue samples with spatial resolution. The barcoding technology uses antibodies or RNA probes that are tagged with a photocleavable oligonucleotide. These tagged oligonucleotides are released upon exposure to UV light projected on a ROI of the tissue. These tags are then collected and then quantified with nCounter® optical barcodes or an Illumina sequencer. The GeoMx DSP detects gene expression from a single or multiple ROIs as selected by the user on a tissue section.
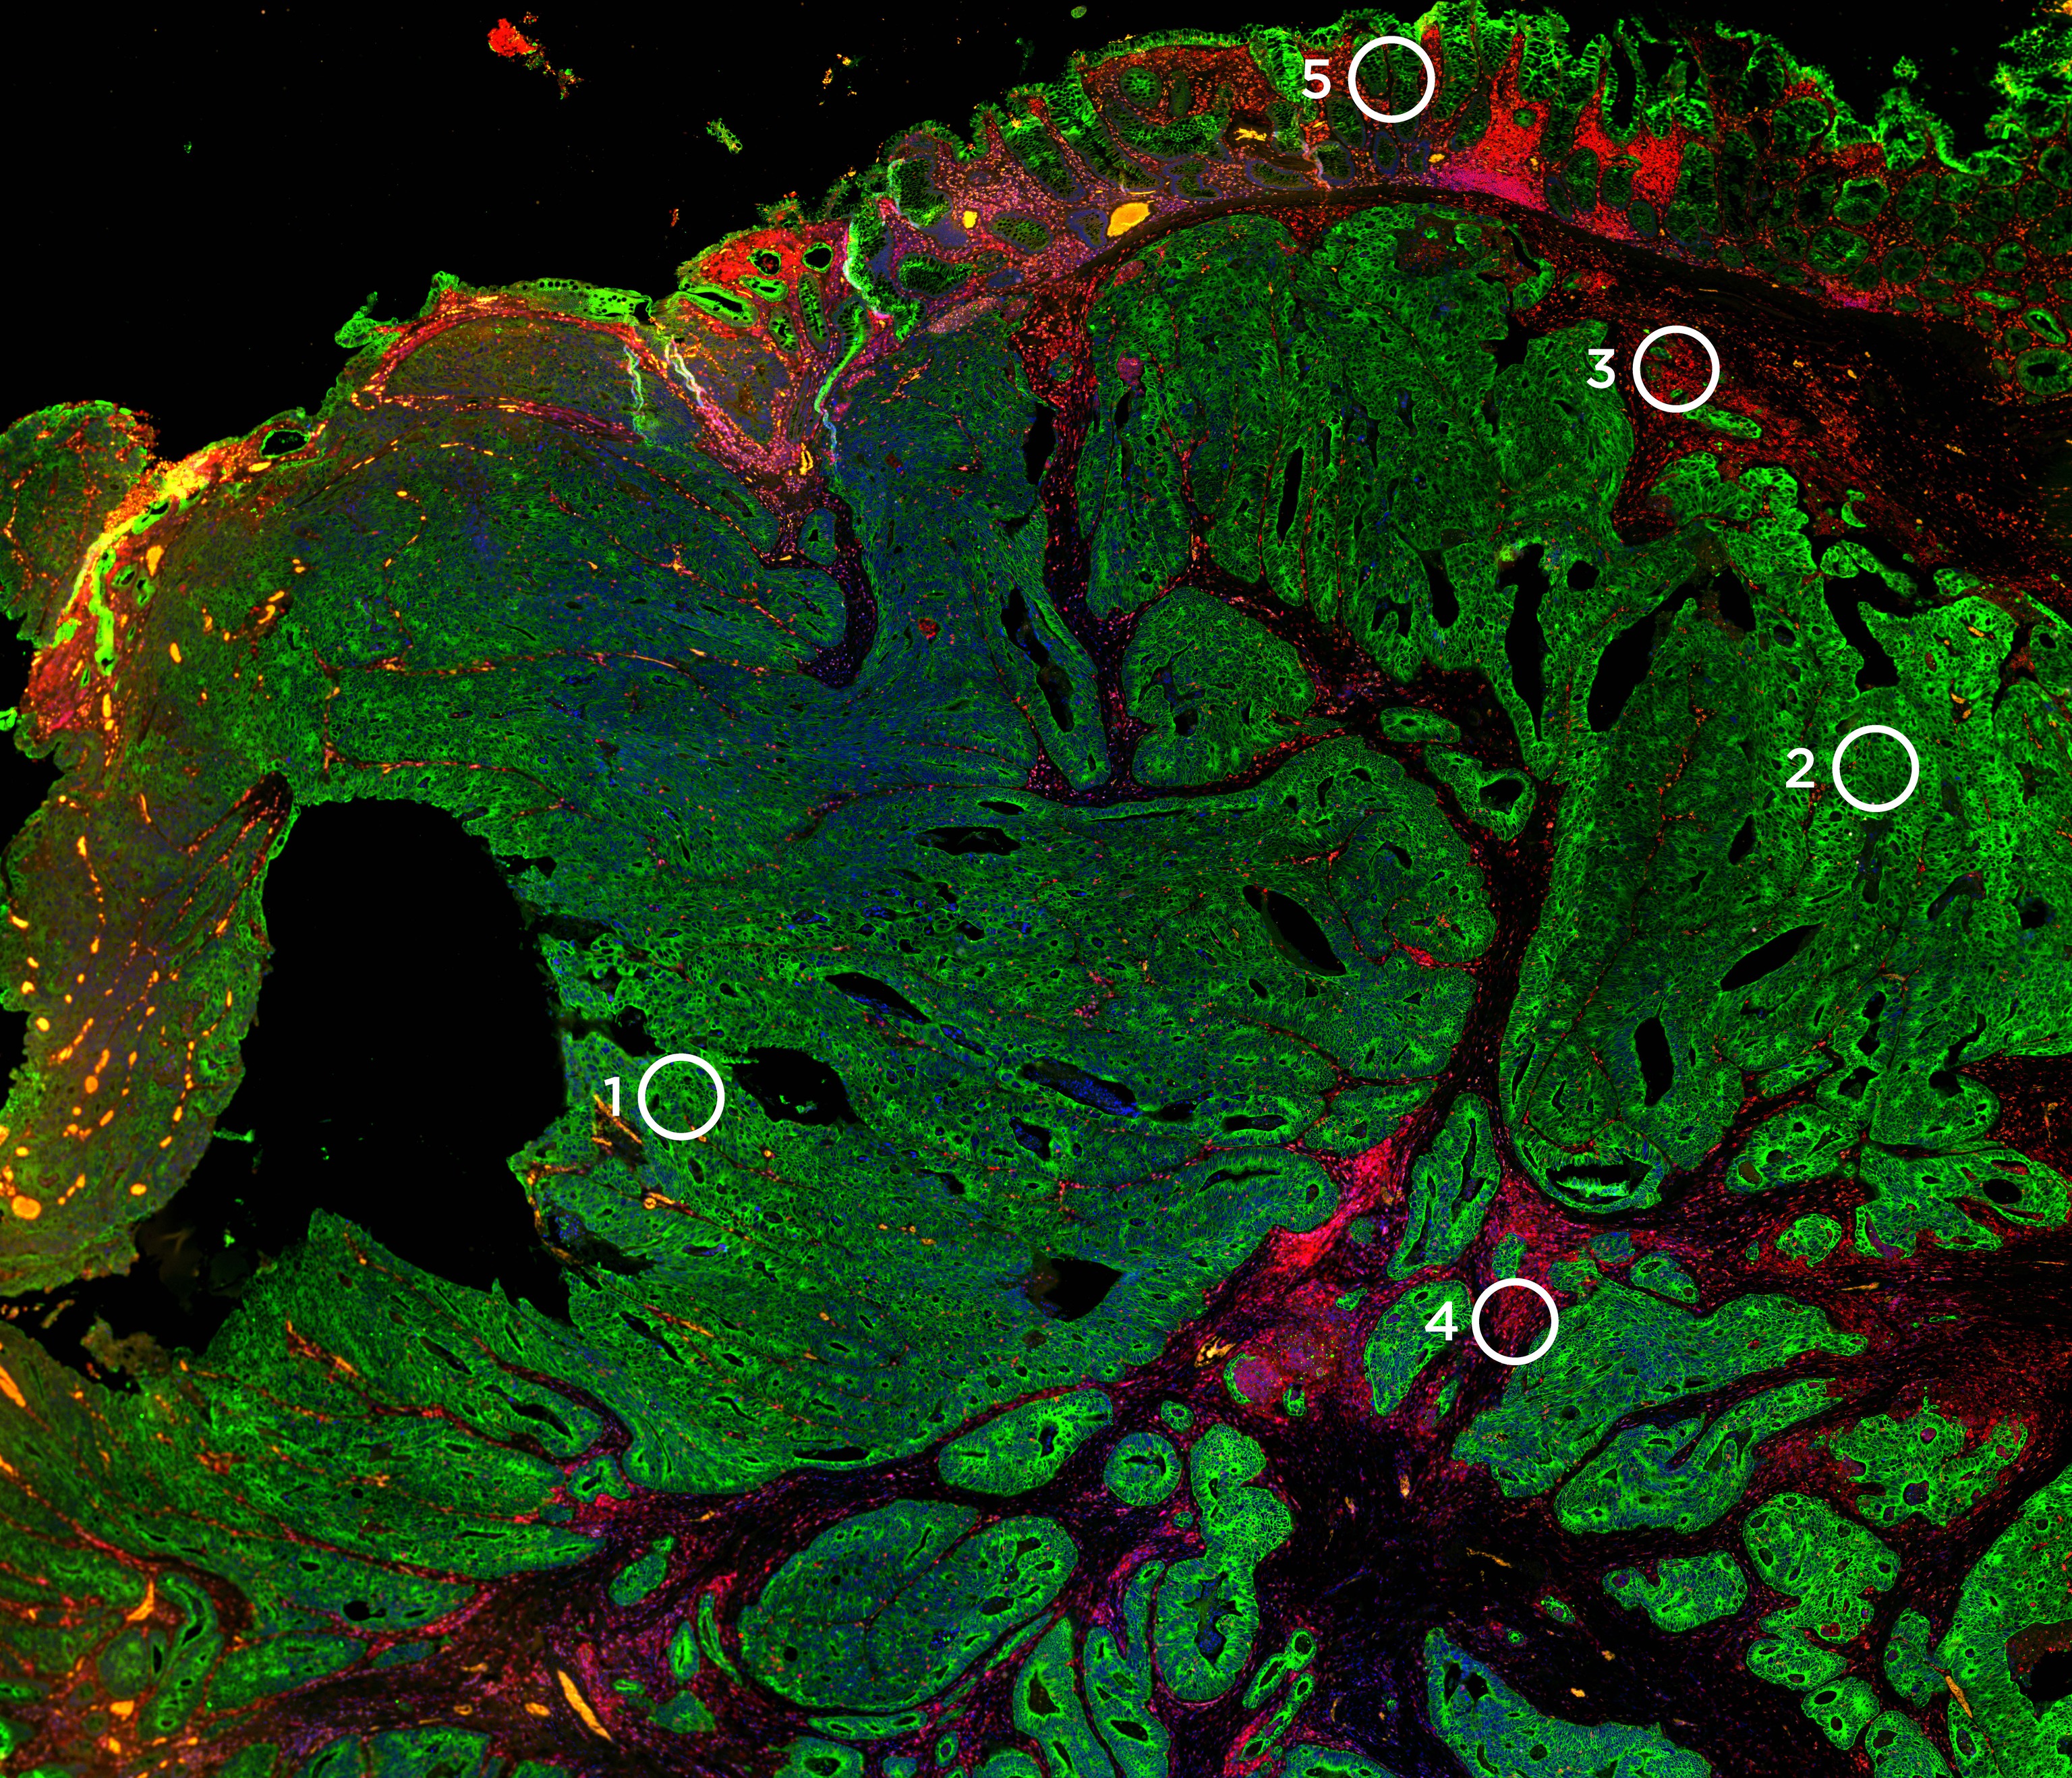
ROI selection based on morphology
The identification of the ROI is a crucial step in the GeoMx DSP workflow. The ROI selection is guided using morphology markers that are integrated into the workflow of the GeoMx DSP. Morphology markers are either fluorescently labeled antibodies or RNA in situ probes that help identify anatomical structures, tissue compartments, and cell types, based on which the ROI can be placed into meaningful groups for subsequent quantification of gene expression.
Flexible ROI strategy
One of the major advantages of the GeoMx DSP platform is a flexible and customizable ROI selection strategy. The ROI can be any shape with either regular geometric shapes or irregular shapes or varying numbers (1 to 96) within the viewing area, including non-contiguous areas. This is primarily due to the programmable digital micromirror devices (DMDs) with which the GeoMx DSP instrument can dynamically configure to profile a customized ROI. The DMDs are small electro-mechanical systems that contain an array of steerable reflective micromirrors that direct the UV light to illuminate the ROIs placed in different areas defined by spatial location, and/or morphological markers.
Defining the ROI
Several ROI defining strategies are possible with the GeoMx DSP and include:
- Geometric ROIs that allow profiling with any geometric shape to characterize distinct tissue regions.
- Gridded ROIs that expand on the geometric ROI concept and allow for rigorous spatial mapping using a tunable grid pattern.
- Contour ROIs that evaluate how proximity affects biological response and the local microenvironment around a central structure using radiating ROIs.
- Segmented ROIs that can be further subdivided into distinct biological compartments within a region of interest.
- Cell Type Specific ROI that profiles a cell population guided by cell type-specific morphology markers.
- Complex ROIs represent combinations of segmented, cell type-specific, and contour profiling to enable the characterization of multiple and different compartments within an ROI.
Analysis and interpretation with GeoMx DSP
GeoMx DSP comes with built-in data analysis software that simplifies data visualization and interpretation. The software displays high-resolution images side-by-side with quantitative profiling data allowing users to interact with either dataset in real-time. Using the fully integrated workflow, users can switch from data collection to data analysis by tracking image data and corresponding profiling data. To visualize the distribution of protein or gene expression across multiple tissue compartments, the software can generate figures such as heatmaps, box plots, and bar graphs. Moreover, the software can identify statistical changes in gene expression between experimental groups (e.g., t-tests, linear mixed models), visualize large data matrices using dendrograms and clustering analyses to discover biomarkers and perform pathway analyses to understand disease mechanisms of action and identify novel targets.
Applications of GeoMx DSP
Spatial gene and protein expression profiling with the GeoMx DSP has enabled discoveries in many research fields including oncology, immunology, neuroscience, and infectious disease. Some of the recent publications discussed below highlight the translational capabilities of the GeoMx DSP platform.
Breast cancer is a highly heterogeneous disease for its histology, epidemiology, and molecular properties. Understanding the molecular diversity of breast cancer, therefore, is of utmost importance in determining the right therapy. The study of McNamara et al., 2021 used the GeoMx DSP platform to spatially resolve protein expression in the tumor and microenvironment compartments on archival FFPE tissue from the HER2+ neoadjuvant breast cancer.1McNamara KL, Caswell-Jin JL, Joshi R, Ma Z, Kotler E, Bean GR, Kriner M, Zhou Z, Hoang M, Beechem J, Zoeller J, Press MF, Slamon DJ, Hurvitz SA, Curtis C. Spatial proteomic characterization of HER2-positive breast tumors through neoadjuvant therapy predicts response. Nat Cancer. 2021 Apr;2(4):400-413. doi: 10.1038/s43018-021-00190-z. Epub 2021 Apr 8. PMID: 34966897; PMCID: PMC8713949. The study showed a change in expression levels of CD45 (an immune biomarker) upon treatment that could predict patient outcomes. Another study by Moutafi et al investigated patients with advanced non-small-cell lung cancer (NSCLC) who failed to derive significant benefit from programmed cell death protein-1 (PD-1) axis blockade therapy, which is a standard treatment for multiple malignancies. Using the GeoMx DSP, it was shown that CD44, a non-kinase transmembrane glycoprotein, was overexpressed in the tumor compartment, but not in the immune compartment, predicting clinical outcomes from PD-1 axis blockade.2Moutafi MK, Molero M, Martinez Morilla S, Baena J, Vathiotis IA, Gavrielatou N, Castro-Labrador L, de Garibay GR, Adradas V, Orive D, Valencia K, Calvo A, Montuenga LM, Ponce Aix S, Schalper KA, Herbst RS, Paz-Ares L, Rimm DL, Zugazagoitia J. Spatially resolved proteomic profiling identifies tumor cell CD44 as a biomarker associated with sensitivity to PD-1 axis blockade in advanced non-small-cell lung cancer. J Immunother Cancer. 2022 Aug;10(8):e004757. doi: 10.1136/jitc-2022-004757. PMID: 36002182; PMCID: PMC9413286.
In the field of neurobiology, the GeoMx DSP was utilized to understand the underlying neurodegenerative changes in resilient individuals who demonstrated neuropathologic changes consistent with Alzheimer’s disease yet remain cognitively normal. Spatial expression analysis for proteins associated with CNS cell-typing or known neurodegenerative changes were done on the hippocampal neurofibrillary tangle (NFT)-bearing neurons, non-NFT-bearing neurons, and their immediate neuronal microenvironments on FFPE sections.3Walker JM, Kazempour Dehkordi S, Fracassi A, Vanschoiack A, Pavenko A, Taglialatela G, Woltjer R, Richardson TE, Zare H, Orr ME. Differential protein expression in the hippocampi of resilient individuals identified by digital spatial profiling. Acta Neuropathol Commun. 2022 Feb 14;10(1):23. doi: 10.1186/s40478-022-01324-9. PMID: 35164877; PMCID: PMC8842950. The study identified 11 proteins displaying differential expression in NFT-bearing neurons of the resilient individual compared to affected individuals, suggestive of an environment containing less energetic and oxidative stress, which in turn results in the maintenance of neurons and their synaptic connections.
In conclusion, there remains much to learn about better targets for drugs, predictors of response to therapy, and biological mechanisms of action based on protein and RNA localization within tissues. With the capability of the GeoMx DSP to rapidly and quantitatively characterize tissue morphology with high-throughput, high-plex RNA and protein profiling that preserves samples for future analyses, can address a wide range of biological questions and could potentially be utilized for prognostic and predictive clinical decision-making.
References
- 1McNamara KL, Caswell-Jin JL, Joshi R, Ma Z, Kotler E, Bean GR, Kriner M, Zhou Z, Hoang M, Beechem J, Zoeller J, Press MF, Slamon DJ, Hurvitz SA, Curtis C. Spatial proteomic characterization of HER2-positive breast tumors through neoadjuvant therapy predicts response. Nat Cancer. 2021 Apr;2(4):400-413. doi: 10.1038/s43018-021-00190-z. Epub 2021 Apr 8. PMID: 34966897; PMCID: PMC8713949.
- 2Moutafi MK, Molero M, Martinez Morilla S, Baena J, Vathiotis IA, Gavrielatou N, Castro-Labrador L, de Garibay GR, Adradas V, Orive D, Valencia K, Calvo A, Montuenga LM, Ponce Aix S, Schalper KA, Herbst RS, Paz-Ares L, Rimm DL, Zugazagoitia J. Spatially resolved proteomic profiling identifies tumor cell CD44 as a biomarker associated with sensitivity to PD-1 axis blockade in advanced non-small-cell lung cancer. J Immunother Cancer. 2022 Aug;10(8):e004757. doi: 10.1136/jitc-2022-004757. PMID: 36002182; PMCID: PMC9413286.
- 3Walker JM, Kazempour Dehkordi S, Fracassi A, Vanschoiack A, Pavenko A, Taglialatela G, Woltjer R, Richardson TE, Zare H, Orr ME. Differential protein expression in the hippocampi of resilient individuals identified by digital spatial profiling. Acta Neuropathol Commun. 2022 Feb 14;10(1):23. doi: 10.1186/s40478-022-01324-9. PMID: 35164877; PMCID: PMC8842950.