Getting Started with Your First GeoMx® DSP Experiment: A Step-by-Step Guide
The GeoMx Digital Spatial Profiler (DSP) is a powerful tool for spatial multiomics, the in situ analysis of RNA and protein expression in tissue sections.
GeoMx DSP gives you the power to detect the expression of the whole transcriptome and/or hundreds of proteins from distinct tissue structures and cellular compartments from formalin-fixed, paraffin-embedded (FFPE) or fresh frozen tissue sections (FF). A five-log dynamic range, probe-based assays, and a repeatability of more than 92% ensure you can pick up on low, medium, and high expressors with confidence.
GeoMx DSP puts you in the driver’s seat and lets you decide where to draw the line and profile the histological structures and cell populations that matter most to your research questions, providing you with the highest levels of sensitivity and specificity. GeoMx DSP works best when you thoughtfully plan your experiment. Collaboration with colleagues who have expertise in histopathology, molecular biology, data management and analysis is encouraged as it not only adds value to your study but also maximizes the chances of success.

Wondering where to begin and how to get started planning your first GeoMx DSP experiment? No problem! Read our quick start guide to get going in no time!
Step 1: Define Your Spatial Question
What do you want to profile and from where in the tissue?
Once you have decided what disease area and tissue type you are going to study, it’s time to define your spatial question; in other words, what area(s) of the tissue are you studying and why? Because GeoMx DSP relies on an immunofluorescent (IF) stained image of the tissue to guide region of interest (ROI) selection, it helps to be familiar with the geography of the tissue type(s) you are studying and/or work closely with a pathologist who is familiar with histology.
You can use an H&E (hematoxylin and eosin) serial section to help orient yourself and decide which areas of the tissue to focus on. If you do not have access to a pathologist and are not familiar with the morphology of your tissue, you could use another spatial biology platform, such as the CosMx® Spatial Molecular Imager, that covers the whole tissue area upstream of your GeoMx DSP experiment to decide which cellular neighborhoods are worthy of further inspection.
Here are some guiding inquiries that will help you define your spatial question:
- Do you have a particular hypothesis in mind or are you simply looking to sample the heterogeneity of the tissue and discover novel biology?
- Are you going to be sampling the same regions of tissue on each sample and comparing sets of samples to each other as in normal vs. diseased tissue or are you looking to compare different regions of tissue or cell populations to each other within one sample?
- Are there any cell types that are of particular interest to you and if so, do you want to characterize the expression profiles of these cells in different areas of the tissue?
- Is there a key feature within the tissue such as the tumor invasive margin, amyloid-beta plaque, or neurofibrillary tangle that you want to use as a landmark around which you want to measure expression?
For example: How does gene and/or protein expression differ in CD45+ immune cells localized in different compartments of the tumor and tumor microenvironment in breast cancer – specifically in the tumor core, along the tumor edge, and in the adjacent stroma?
Step 2: Choose Your GeoMx DSP Assay
Do you want to profile RNA, protein, or both?
Once you have defined your spatial question, you need to decide whether you are going to profile RNA or protein or both! GeoMx DSP can profile RNA or protein separately or profile both together simultaneously from a single sample with our spatial proteogenomic workflow. GeoMx DSP assays are available for human, mouse, and canine. You can profile a limited set of targets or profile upwards of 570 proteins or 18,000 RNAs.
If you are studying a different species, you can work with the NanoString bioinformatics team to create a custom RNA or protein assay and/or spike-in probes to an off-the-shelf assay. A custom standalone GeoMx RNA assay can be created from scratch with up to 400 targets. Customization for protein assays is offered as a service or through a DIY protein barcoding kit.
For Example: Profiling of RNA in human colorectal cancer FFPE tissue sections with the GeoMx Human Whole Transcriptome Atlas
Step 3: Choose Your Morphology Markers
What markers would you like to visualize in the tissue?
The first step of the GeoMx workflow is staining the tissue with fluorescently labeled antibodies or in situ hybridization (ISH) probes so that you can image the tissue and better understand the tissue morphology. Once the tissue is imaged, you choose which regions of interest (ROIs) you want to profile based on the fluorescent staining pattern. Choosing which morphology markers to label is important as this informs which anatomical structures, tissue regions, and/or cell types are visible in the image. Each ROI can be profiled as an individual biological compartment or separated into two or more biological compartments or areas of illumination (AOI) based on the prevalence of specific morphology markers or cell types.
A typical GeoMx experiment uses a max of four morphology markers: one is usually a DNA counterstain (typically SYTO 13) and the other three can be experimentally defined. The LED filter sets on the GeoMx system are centered on standard FITC, Cy3, Texas Red, and Cy5 channels.
Several commercially available morphology marker kits are available off-the-shelf for oncology or neuroscience studies with human or mouse tissues.
NanoString has tested hundreds of custom morphology markers in R&D and our Technology Access Program; these include markers for human, mouse, and canine tissues and antibodies as well as RNAScope in situ hybridization (ISH) probes. Detailed information can be found on our Morphology Marker webpage as well as in our downloadable Morphology Marker Reference List.
For example: Morphology marker staining using the Solid Tumor Morphology Marker Kit with CD45, PanCK, and SYTO13.


Step 4: Decide on a Region of Interest Sampling Strategy
Where in the tissue would you like to profile expression?
Once you have selected morphology markers, you will want to start thinking about which regions of the tissue and/or cell types you want to select for expression profiling. In general, there are three different strategies for selection of ROIs: geometric, segmentation, and contour. For your first experiment, we recommend you choose geometric ROIs to streamline and simplify your experimental design and data analysis.
- Geometric: Placement of circles, squares, or polygons on different regions of the tissue to sample the heterogeneity of gene and protein expression
- Segmentation: Selection of distinct tissue structures, anatomical features, or cell types within a given ROI based on the staining pattern of morphology markers
- Contour: Placement of contour lines at fixed distances around a specific feature or landmark in the tissue such as an amyloid-beta plaque, tau tangle, or microbial niche to measure expression as a function of distance from a particular biological landmark
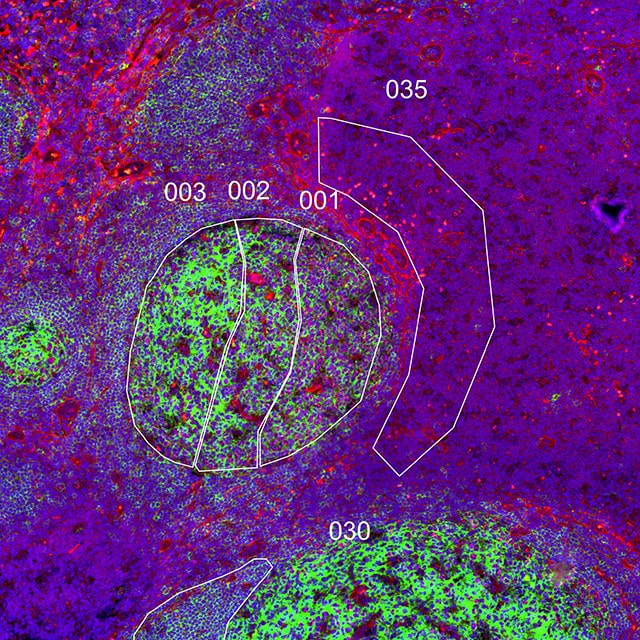
Geometric Profiling
What is the heterogeneity of expression in different regions of my tissue?
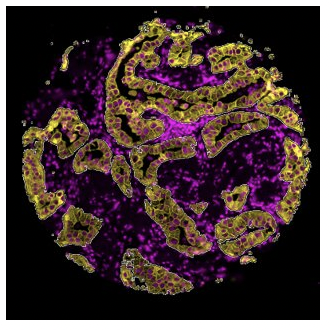
Segmentation
What is the expression profile of distinct biological compartments (e.g., Tumor-TME)?
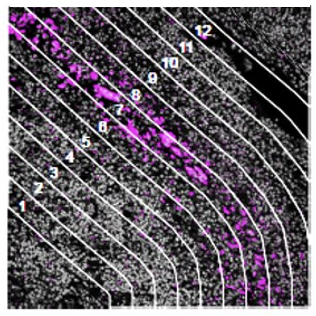
Contour
How does the immune environment change on either side of an infiltrate boundary?
You can segment geometric or polygonal ROIs into two or more distinct biological compartments using the staining pattern to create a mask. For your first experiment, we recommend that you go with the simplest possible ROI selection strategy that still gets you the biological information you need to answer your spatial question. In addition, prioritize using samples that have all the relevant ROIs that you would like to include in your study.
Third party image analysis software such as Visiopharm can be helpful in standardizing ROI selection as well as integrating image analysis workflows with spatial multiomic data.
A minimum of 6 ROIs per type is recommended to enable meaningful statistical analysis so that the experiment will still provide meaningful results even if assay probes from a couple ROIs are lost during subsequent processing steps.
To maximize sensitivity and enable advanced data analysis applications such as spatial deconvolution of different immune cell types, ensure that there are at least 200 cells per ROI for analysis of RNA and 50 cells per ROI for analysis of protein.
For example: Profile separately the CD45+ biological compartment within geometric ROIs placed within the tumor, at the invasive margin, and in the stroma.
Step 5: Define the Data Analysis Plan
Plan your experiment with data analysis in mind up front
To execute a successful GeoMx experiment, it is imperative to know a priori what specific comparisons will be made to assess differential expression. In other words, which groups of ROIs will be compared to each other. It’s important to consider comparing groups of ROIs that have approximately the same area with similar tissue type(s), and cell numbers represented. By understanding which specific data comparisons will be made, you can minimize introducing technical variability at the time a design of experiment is prepared for any given study.
Alternatively, researchers new to Spatial Biology can leverage our GeoMx Spatial Data Analysis Service (sDAS). GeoMx sDAS simplifies the derivation of biological insights from spatial data, eliminating the need for specialized bioinformatics or programming knowledge. This service includes one-on-one work with NanoString’s computational biologists, end-to-end analysis from raw data to tertiary analysis, and an easily understandable report with presentation-ready visualizations. Furthermore, sDAS offers open code sharing for easy integration into existing pipelines, rapid turnaround times to expedite discoveries, and customizable analysis services to help answer your biological question.
Step 6: Design a Pilot Experiment
Test Experimental Conditions
Once you have selected morphology markers and decided where to place ROIs, you can start designing a pilot experiment to test experimental conditions. Pilot studies should include a minimum of 3-6 tissue samples. One process control is recommended per batch of samples processed together, and positive and negative controls for staining are ideal. Best practice for minimizing technical bias is the randomization of experimental factors across containers, instruments, and days on which experiments are conducted.
After thoughtful technical and quality considerations, a pilot study to assess feasibility should be planned and executed to verify that the experimental conditions will generate expected results. This is also an opportunity to test different conditions if any step in the workflow has not been optimized. For example, best practice for minimizing technical bias is randomization of experimental factors across containers, instruments, and days on which experiments are conducted.
Test the staining protocol using selected antibodies to ensure acceptable staining and imaging can be achieved if a segmentation ROI selection strategy is being considered. Start with slide preparation and staining conditions recommended by NanoString. Test antibody concentrations below and above the recommendation. Antigen retrieval and antibody concentrations may need optimization for unique tissues. Verify that 200 cells will generate the desirable level of sensitivity and dynamic range.
Plan a smart pooling strategy if you are counting probes using sequencing: e.g., pool similar AOI types and run library QC prior to multiplexing with other AOI types. Pool equimolar concentration of similar AOI types and library sizes (in basepairs) in preparation for sequencing.
Adjust any test conditions prior to analyzing study samples.
Measure Where Biology Happens
Now that you have a better idea of how to begin planning your first GeoMx experiment, take a look at the Spatial Tissue Book to see what some of our customers have done in their experiments and get some ideas for your own!


