What is digital spatial profiling?
The function of biological systems depends on the spatial organization of their cells.
Over the past decade, innovative technologies have emerged that can spatially localize and quantify gene expression of mRNA transcripts in intact tissue, giving rise to the field of spatial transcriptomics.
Several spatial transcriptomics methods have been developed that differ in the way they capture and record spatial information. Currently, based on how spatial information is acquired, spatial transcriptomics technologies can be broadly classified into five categories: digital spatial profiling (DSP), fluorescent in situ hybridization (FISH), in situ sequencing (ISS), next generation sequencing (NGS) with spatial barcoding, and methods that do not require a priori spatial location. Amongst these, digital spatial profiling uses molecular barcoding technology to measure gene expression in different regions of interest (ROI) selected on a tissue section.
The DSP technology
Digital spatial profiling (DSP) is a spatial multiomics technology that profiles tissues for mRNA and protein expression using oligonucleotide barcoding. DSP technology can be used on a wide variety of tissue samples including FFPE tissue sections, fresh frozen tissue sections, core needle biopsies, and tissue microarrays. Furthermore, DSP is non-destructive, and precious clinical specimens can therefore be stored and re-probed at any time.
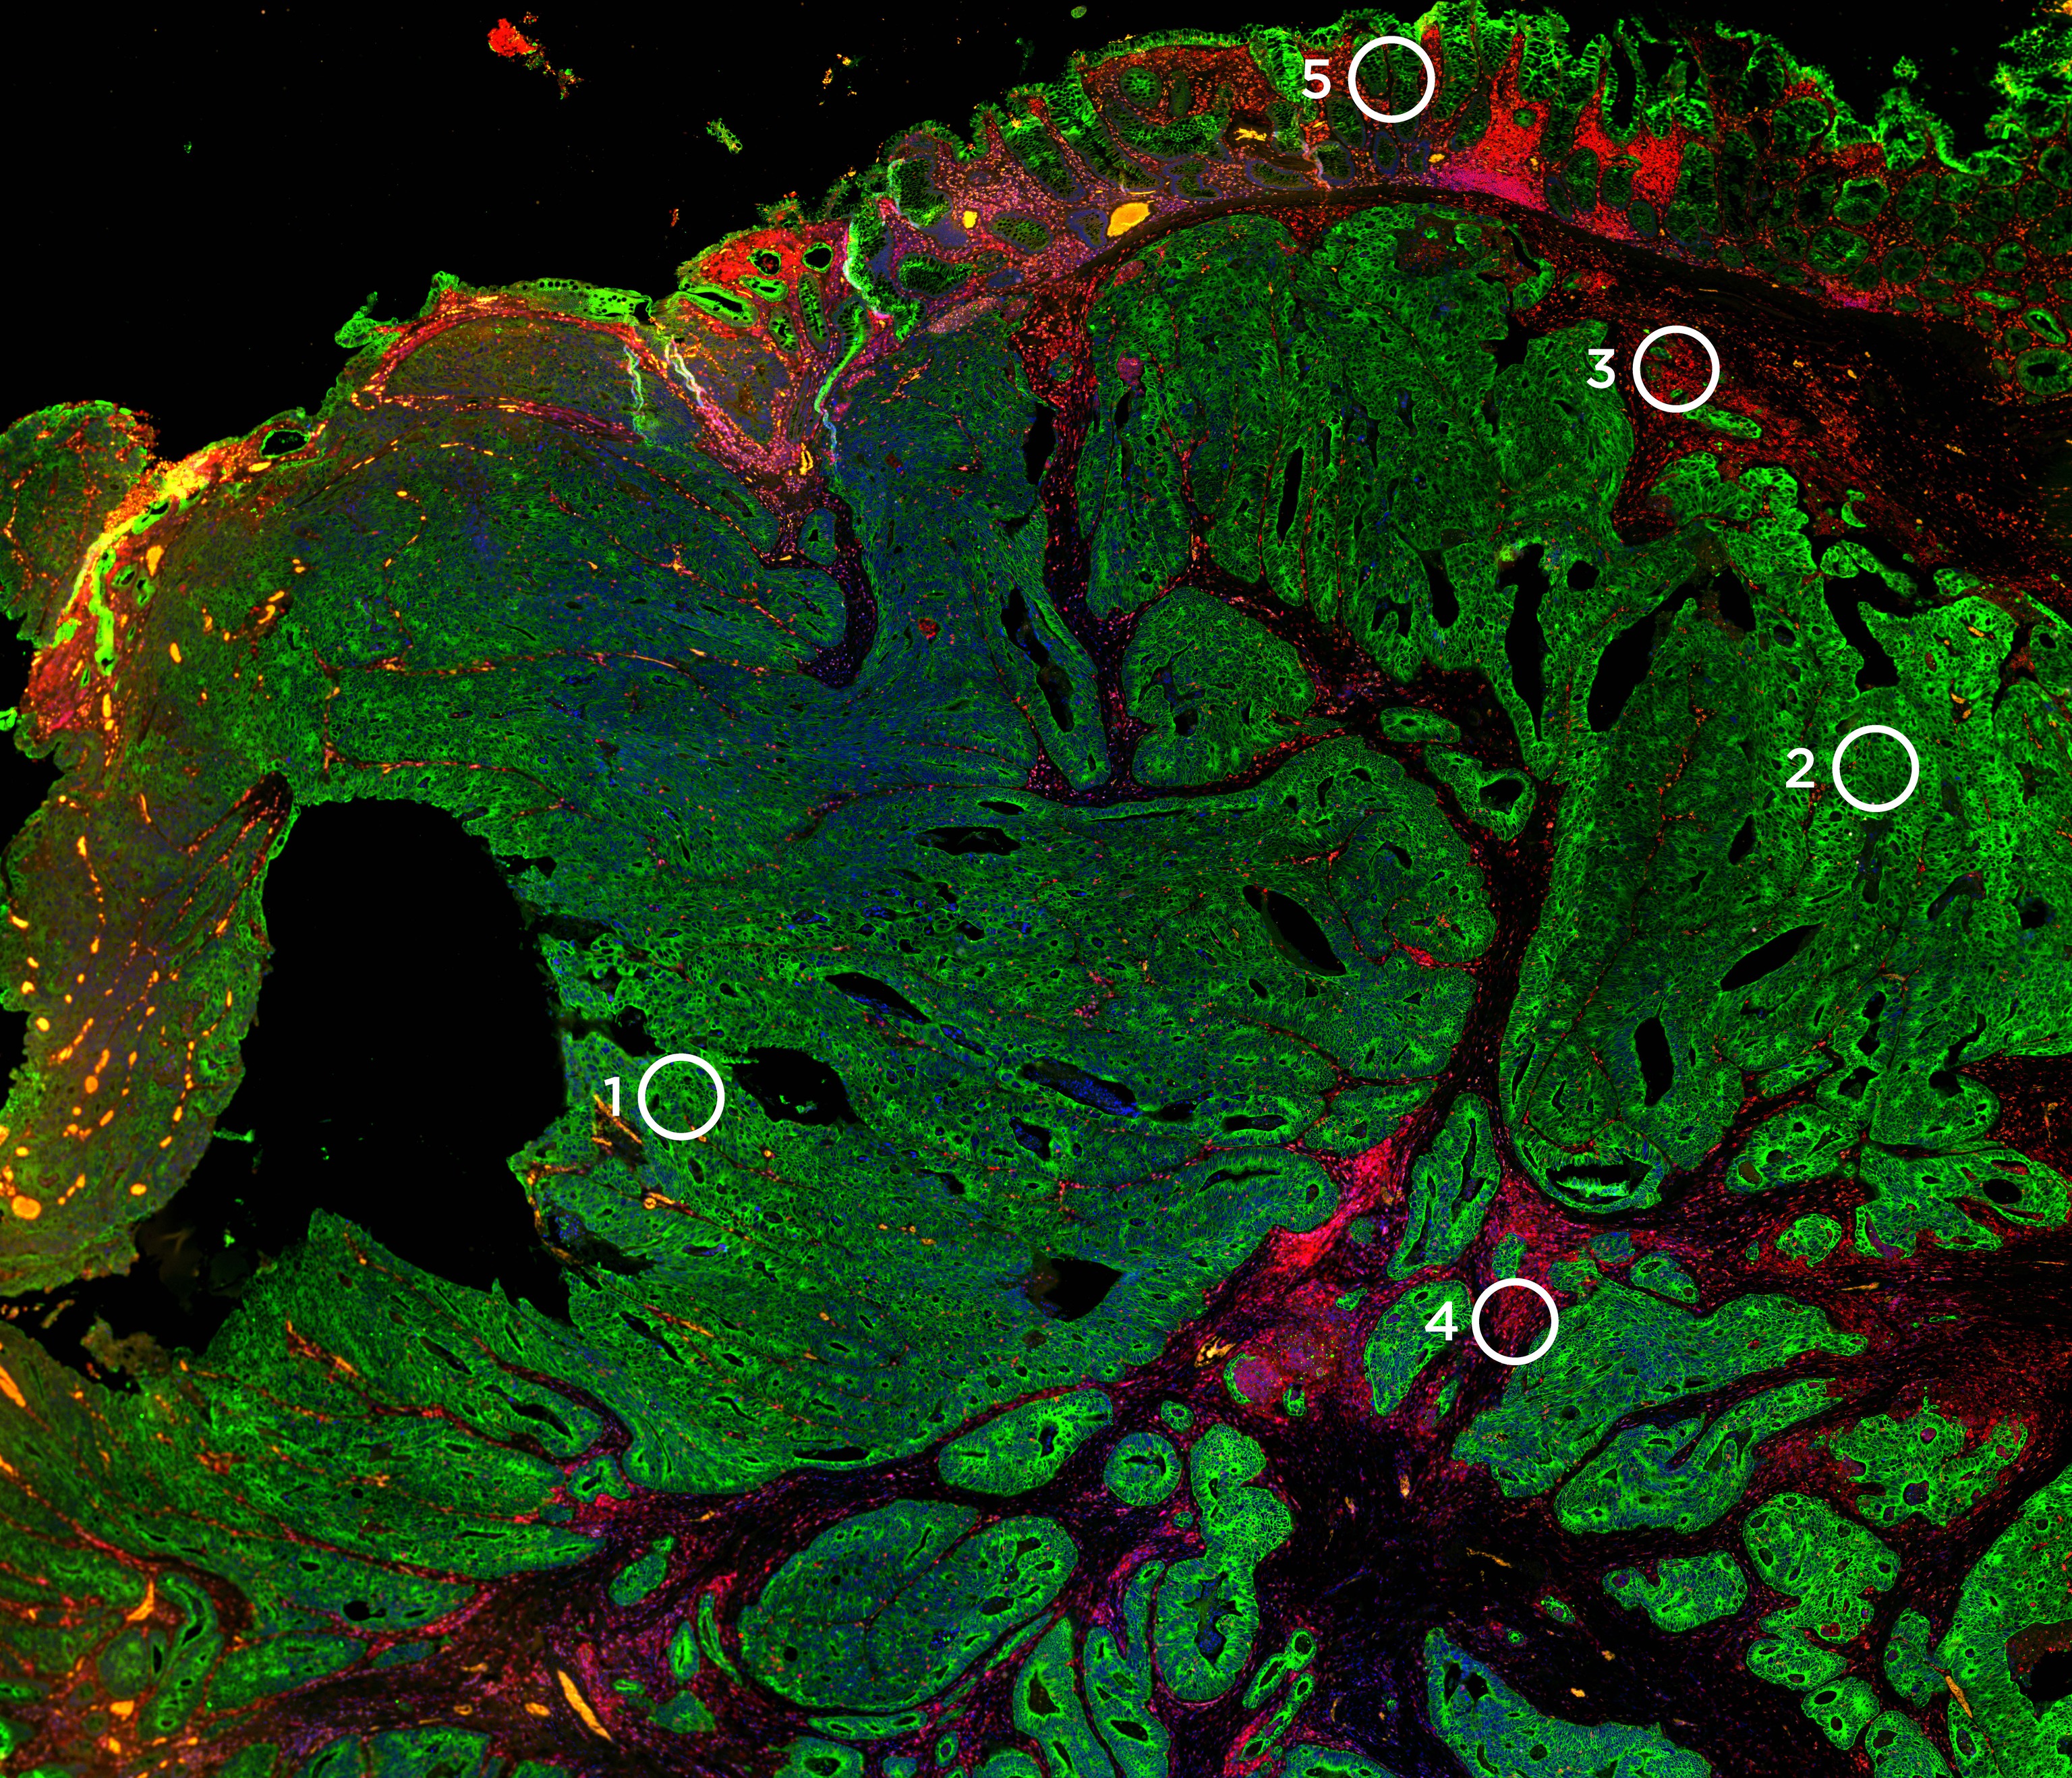
The DSP approach relies on the readout of RNA or proteins using oligonucleotide tags that are attached to antibody or RNA probes through a photocleavable linker. These labeled probes are then hybridized onto a slide-mounted tissue sample that is also stained with fluorescently labeled antibodies or ISH probes that identify tissue morphology. The morphological features identified thus help in ROI selection. UV light is then projected sequentially onto the ROIs selected, triggering the release of the oligonucleotide tags. These tags are then collected and counted digitally using high-throughput sequencing such as that done with an Illumina NGS system.
Data generated by DSP platforms are not direct images, but spatially registered counts of probes that can be mapped back to their spatial locations.
Hence, the data generated by DSP platforms are not direct images, but spatially registered counts of the hybridized probes that can be then mapped back to their spatial locations within the tissue. The GeoMx® Digital Spatial Profiler developed by NanoString was the first digital spatial profiling technology introduced in the market, in 2019.
The GeoMx DSP system
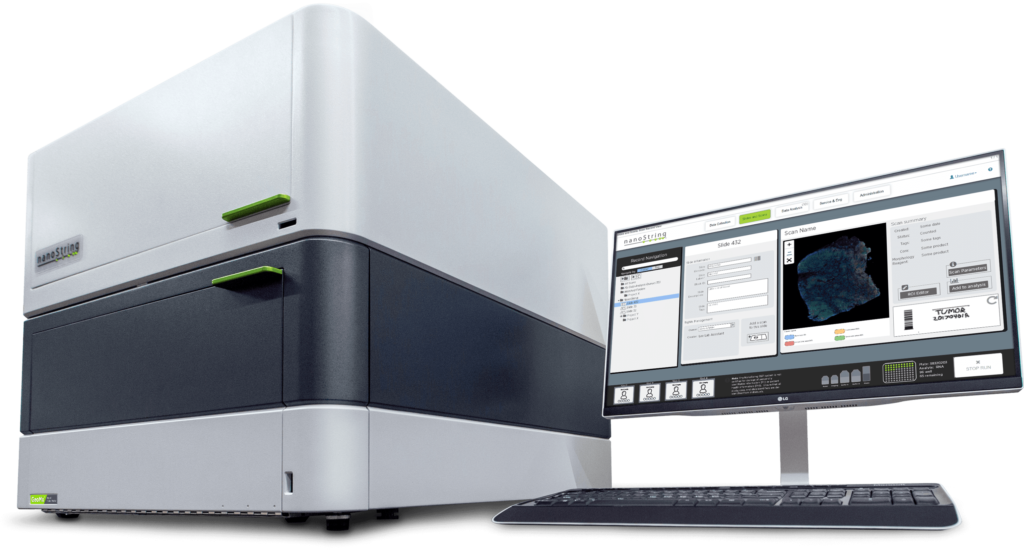
The GeoMx DSP system developed by NanoString Technologies is a fully automated and non-destructive spatial multiomics platform that allows sequential profiling of different ROIs on the same tissue section. The GeoMx DSP uses a combination of genomic detection technologies: NGS and oligonucleotide barcodes; organic chemistry: photocleavable oligonucleotides; and semiconductor technology: a dynamically configurable digital micromirror array and microfluidic sampling to advance histology to higher plex. The GeoMx DSP can profile tens to thousands of mRNA transcripts or 150+ protein analytes separately or simultaneously and works well with degraded FFPE tissue sections.
A key component of the GeoMx DSP instrument is the programmable digital micromirror device (DMD) that allows for flexible and customizable ROI selection for profiling. The DMD technology is made up of an array of micromirrors that can be individually tilted to shine UV light of any pattern onto the tissue. The DMD allows for several unique types of ROIs to be virtually ‘drawn’ on the tissue including geometric shapes, grids, and contours. An entire cell type population can be profiled across the entire field of view with discontinuous ROIs to understand expression patterns across different cells. An ROI can even be divided by tissue masking into different segments based on the staining pattern of morphology markers to understand differential expression between two or more different tissue compartments such as the tumor, immune infiltrate, and stroma.
GeoMx DSP Data Analysis
GeoMx DSP comes with built-in data analysis software that simplifies data visualization and interpretation. The software displays high-resolution images side-by-side with quantitative profiling data, allowing users to interact with either dataset in real-time. Using the fully integrated workflow, users can switch from data collection to data analysis by tracking image data and the corresponding profiling data. To visualize the distribution of protein or gene expression across multiple tissue compartments, the software can generate figures such as heatmaps, box plots, and bar graphs. Moreover, the software can identify statistical changes in gene expression between experimental groups (e.g., t-tests and linear mixed models), visualize large data matrices using dendrograms and clustering analyses to discover biomarkers and perform pathway analyses to understand disease mechanisms of action and identify novel targets.